Map showing the different uses that put pressure on the marine environment. This includes among others vessel tracts, fisheries data, protected and restricted areas. Data sources are:
UNEP/CBD/EBSA/WSPAC/1/2. 2011. Compilation of Scientific Information to Describe EBSAs in the Western South Pacific Region.
KBAs: CEPF
DSM Tenements: Ministry of Lands and Survey, Solomon Islands
Shipping Routes: Solomon Islands Maritime and Ports Authority (SIPA)
Marine Managed Areas: CTAtlas
Vessel Tracks: Exact AIS
he 33 deepwater bioregions for the Solomon Islands were condensed into 26 bioregions. The major changes were made to the northwestern side of the Solomon Islands EEZ; there was general agreement about the deepwater bioregions in the southeastern half of the country. Bioregions 120, 164, 167, 192, 244, and 304 were merged with Bioregion 222. Bioregion 226 was split into two halves, and one part of the non-contiguous Bioregion 240 (the part closer to the islands) was merged with 222.
reef-associated bioregions for the Solomon Islands
Indication of location for the establishment of the Barana and Queen Elizabeth Park to improve the upper Mataniko and Lungga catchment area’s provision of fresh water supply and other ecosystem services.
*refer to Honiara Ecosystem Based Adaptation Option Assessment report for more detailed information*
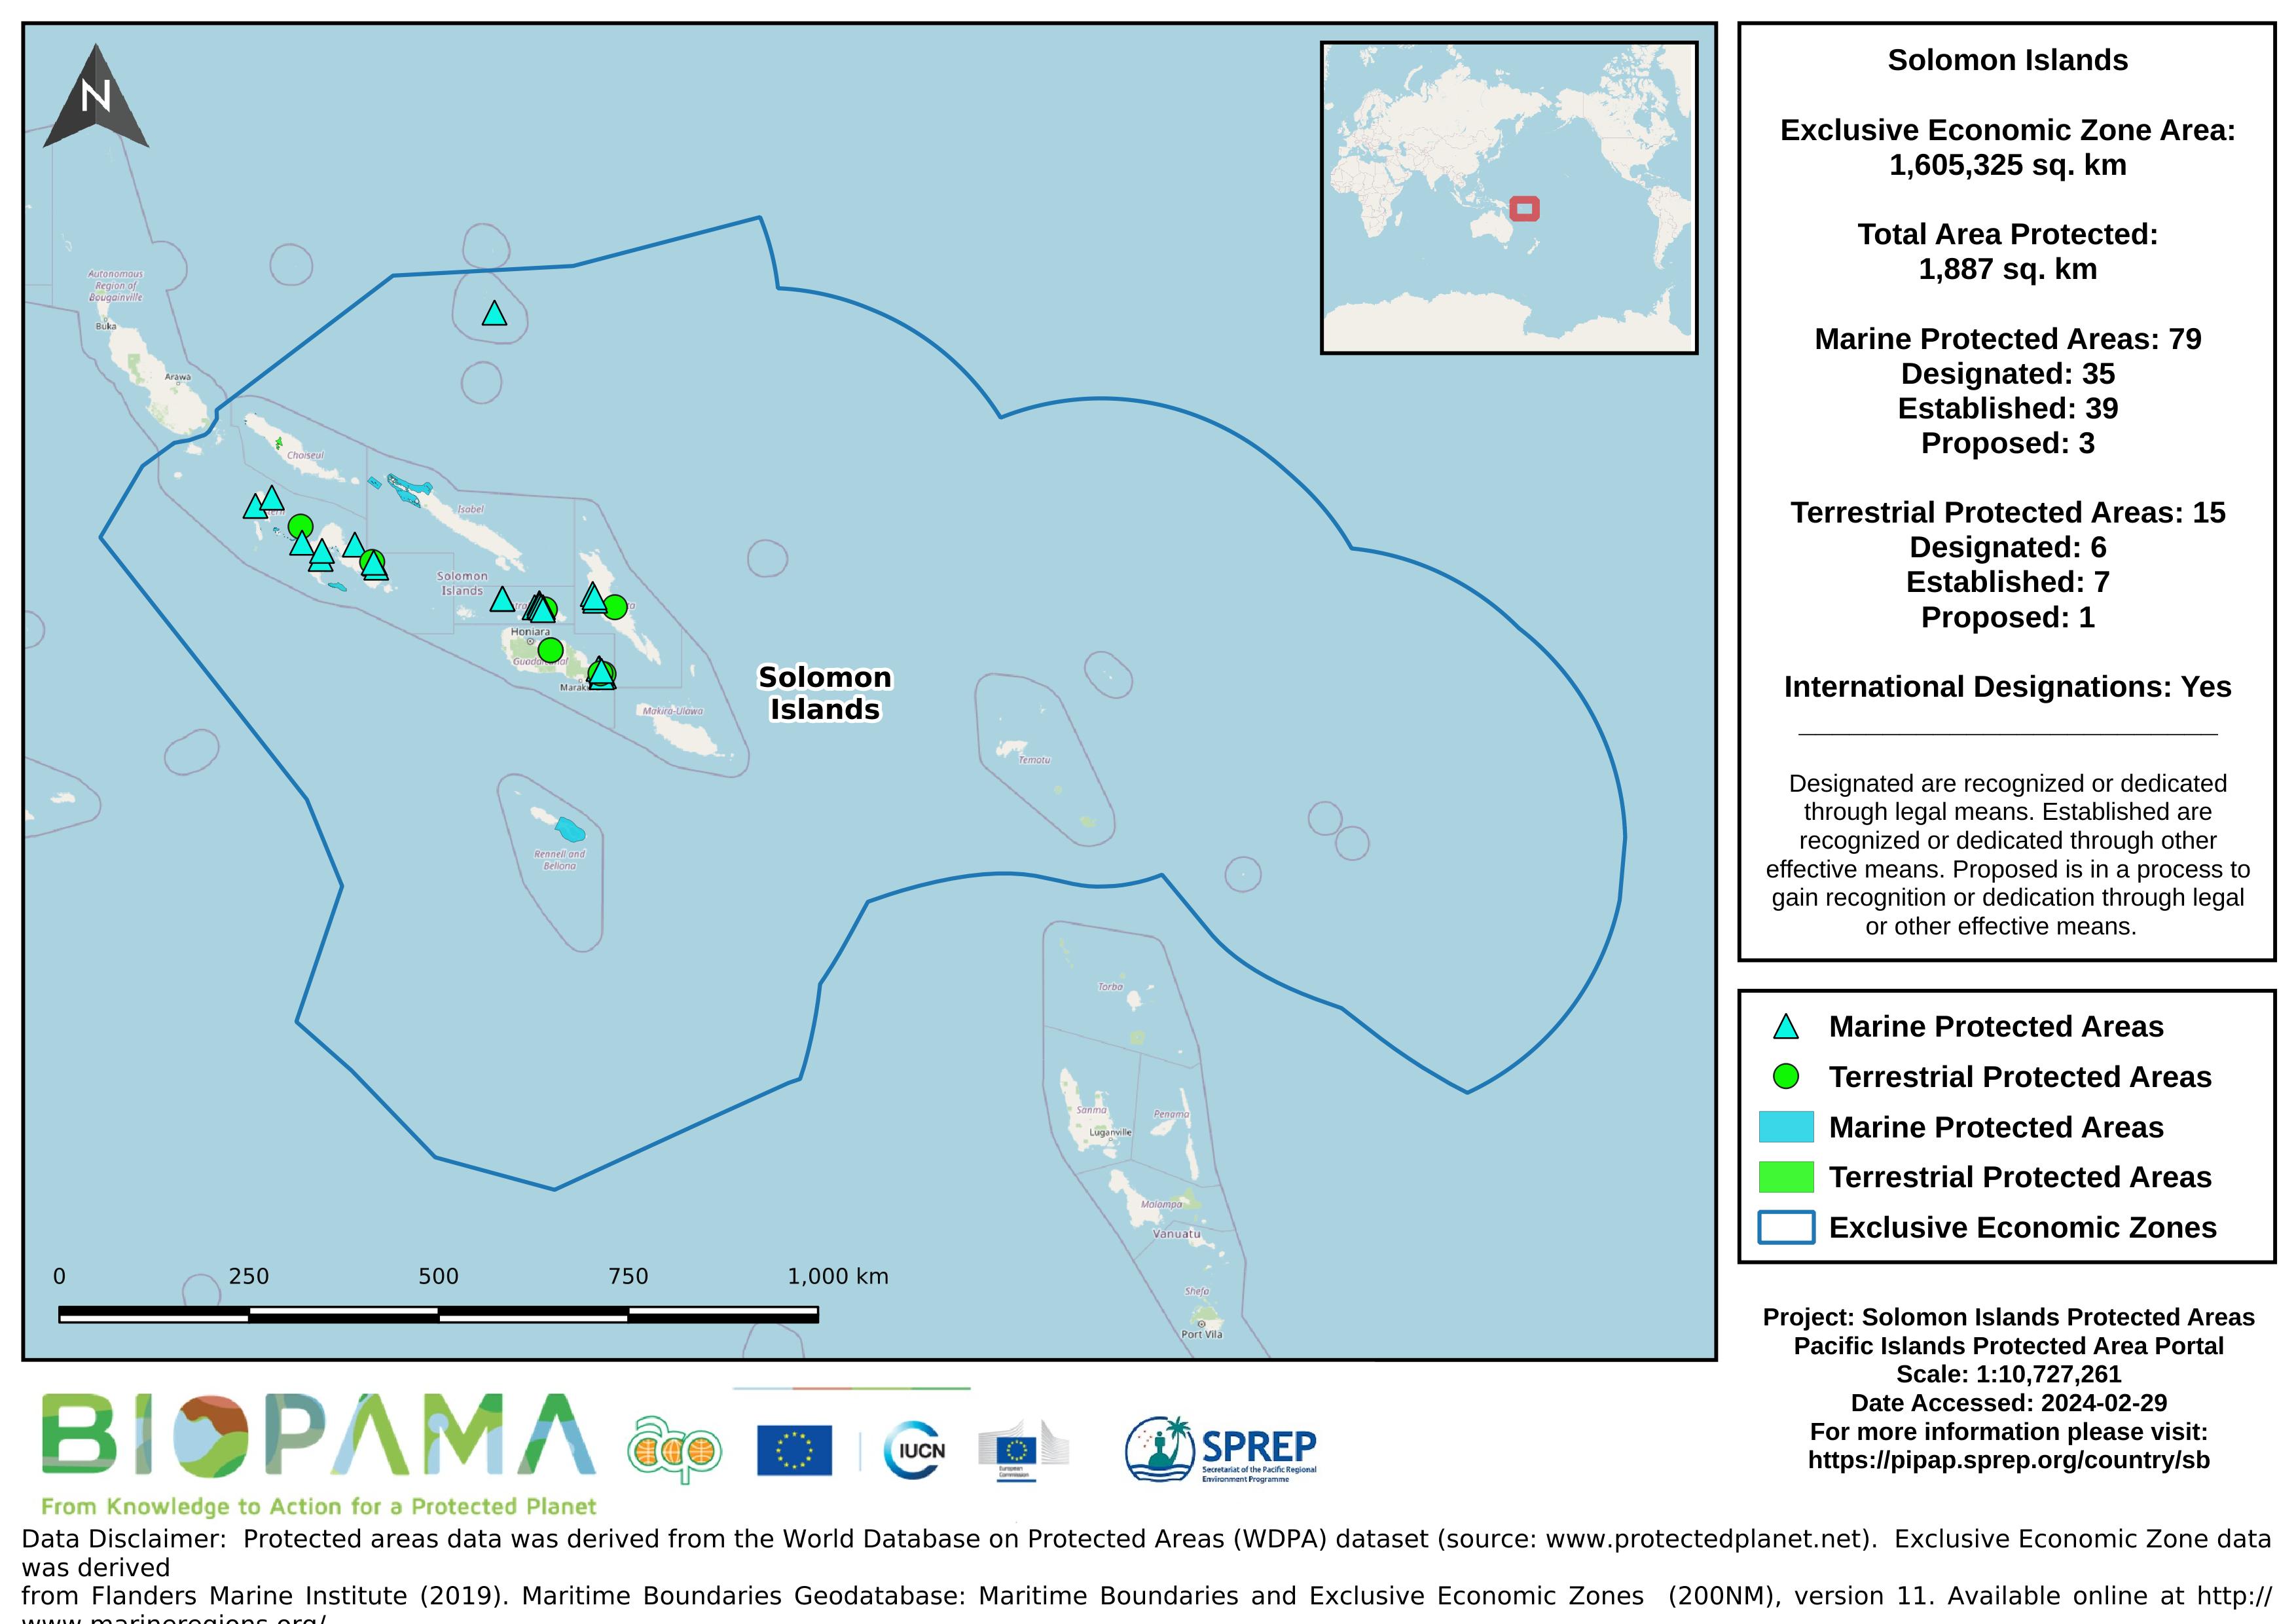
Map of the protected areas for the Solomon Islands with country-level summary statistics on the amount of area under protection, count for each type of protected area (terrestrial or marine), and the count of their designation.
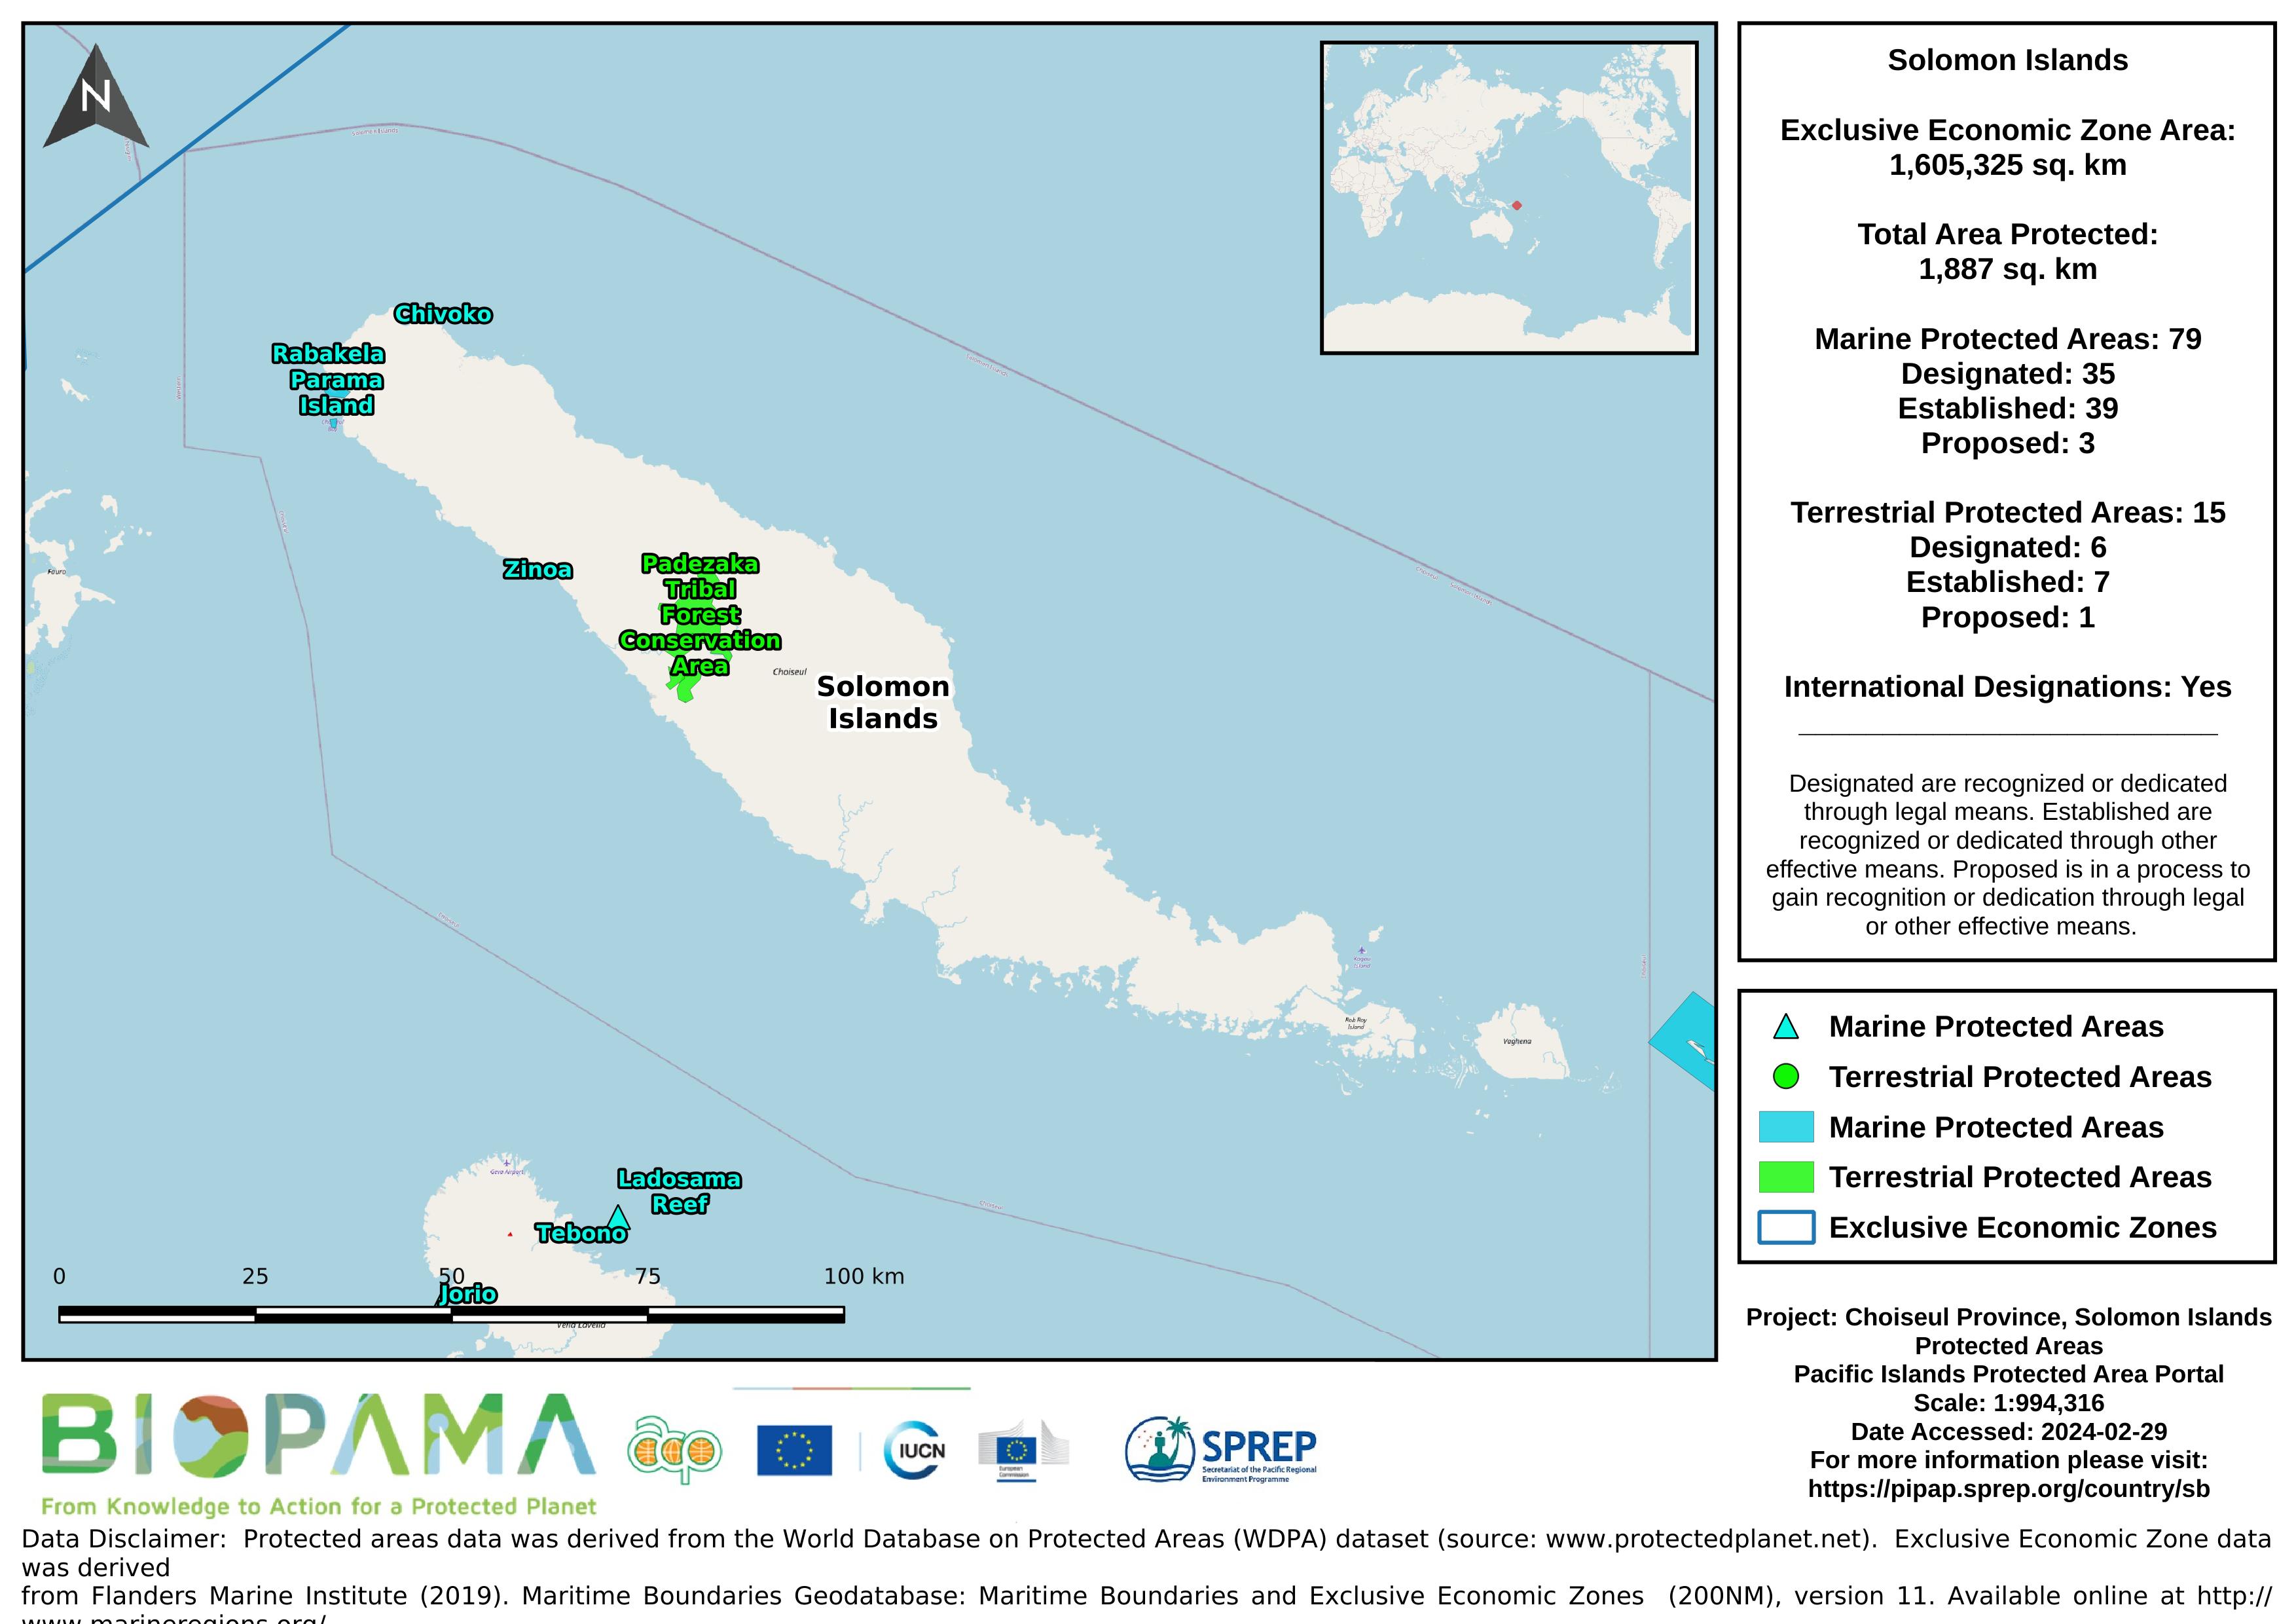
Map of the protected areas for Choiseul province in the Solomon Islands with country-level summary statistics on the amount of area under protection, count for each type of protected area (terrestrial or marine), and the count of their designation.
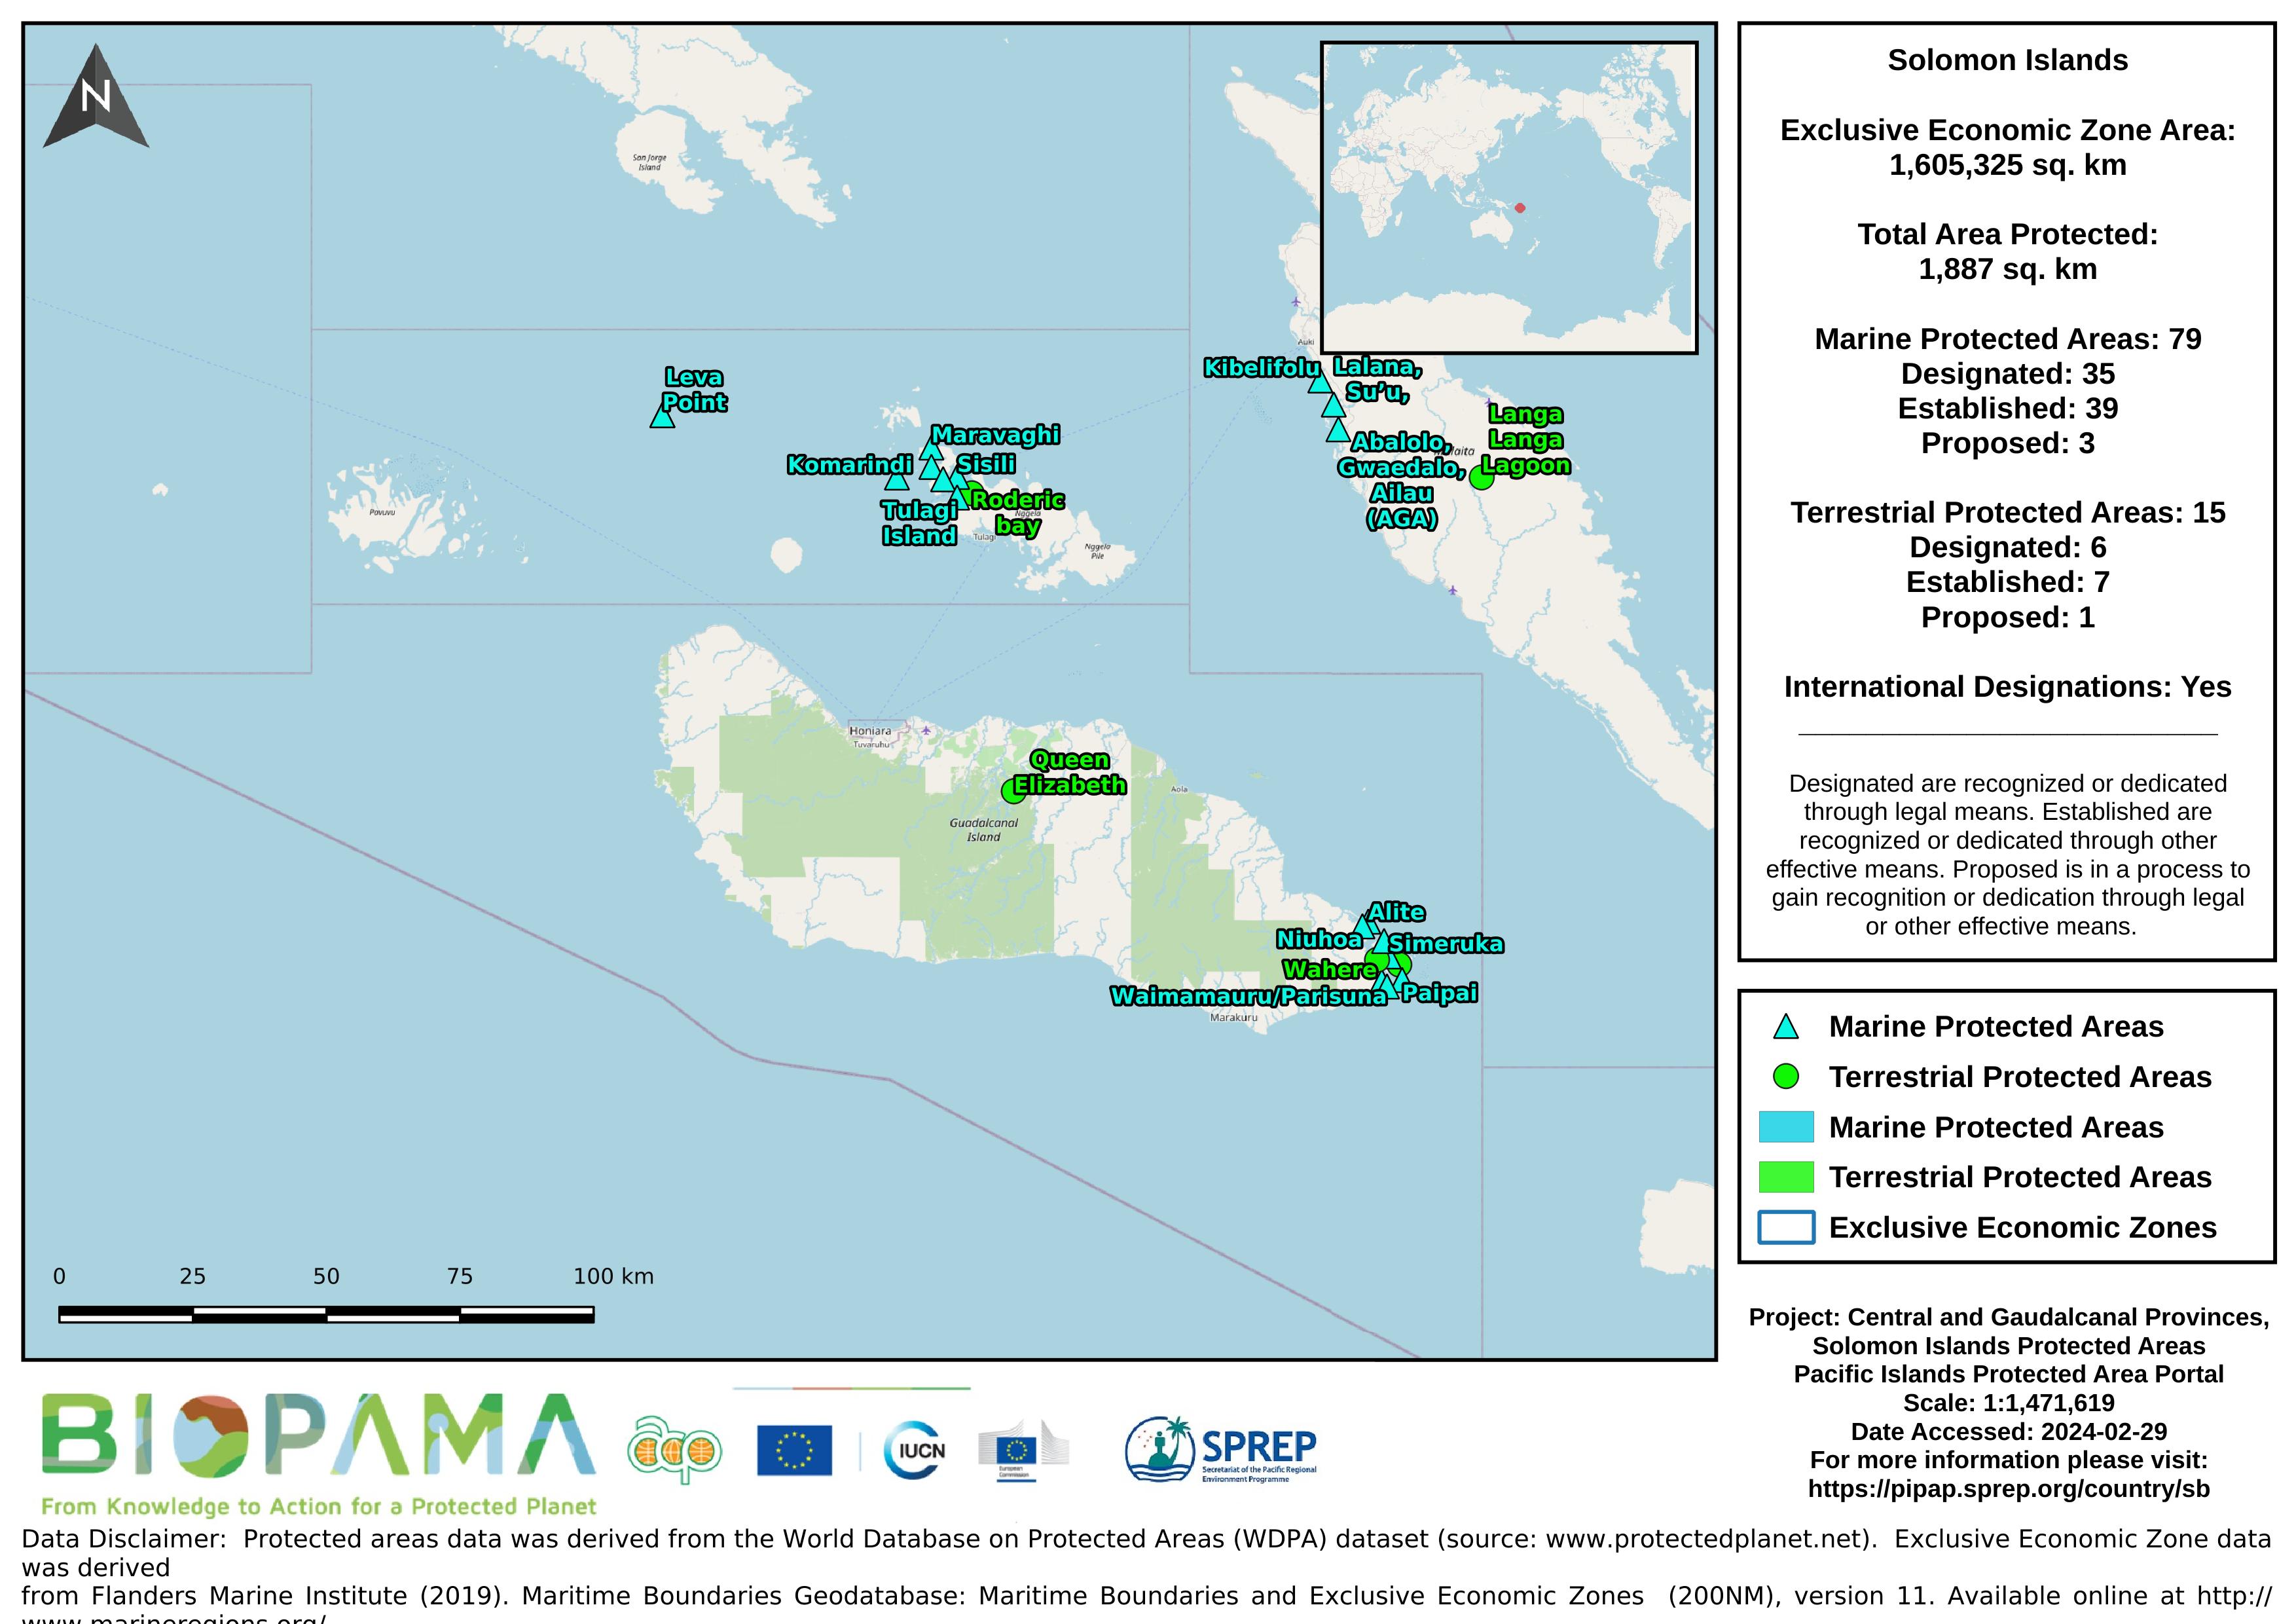
Map of the protected areas for Guadalcanal and Central provinces in the Solomon Islands with country-level summary statistics on the amount of area under protection, count for each type of protected area (terrestrial or marine), and the count of their designation.
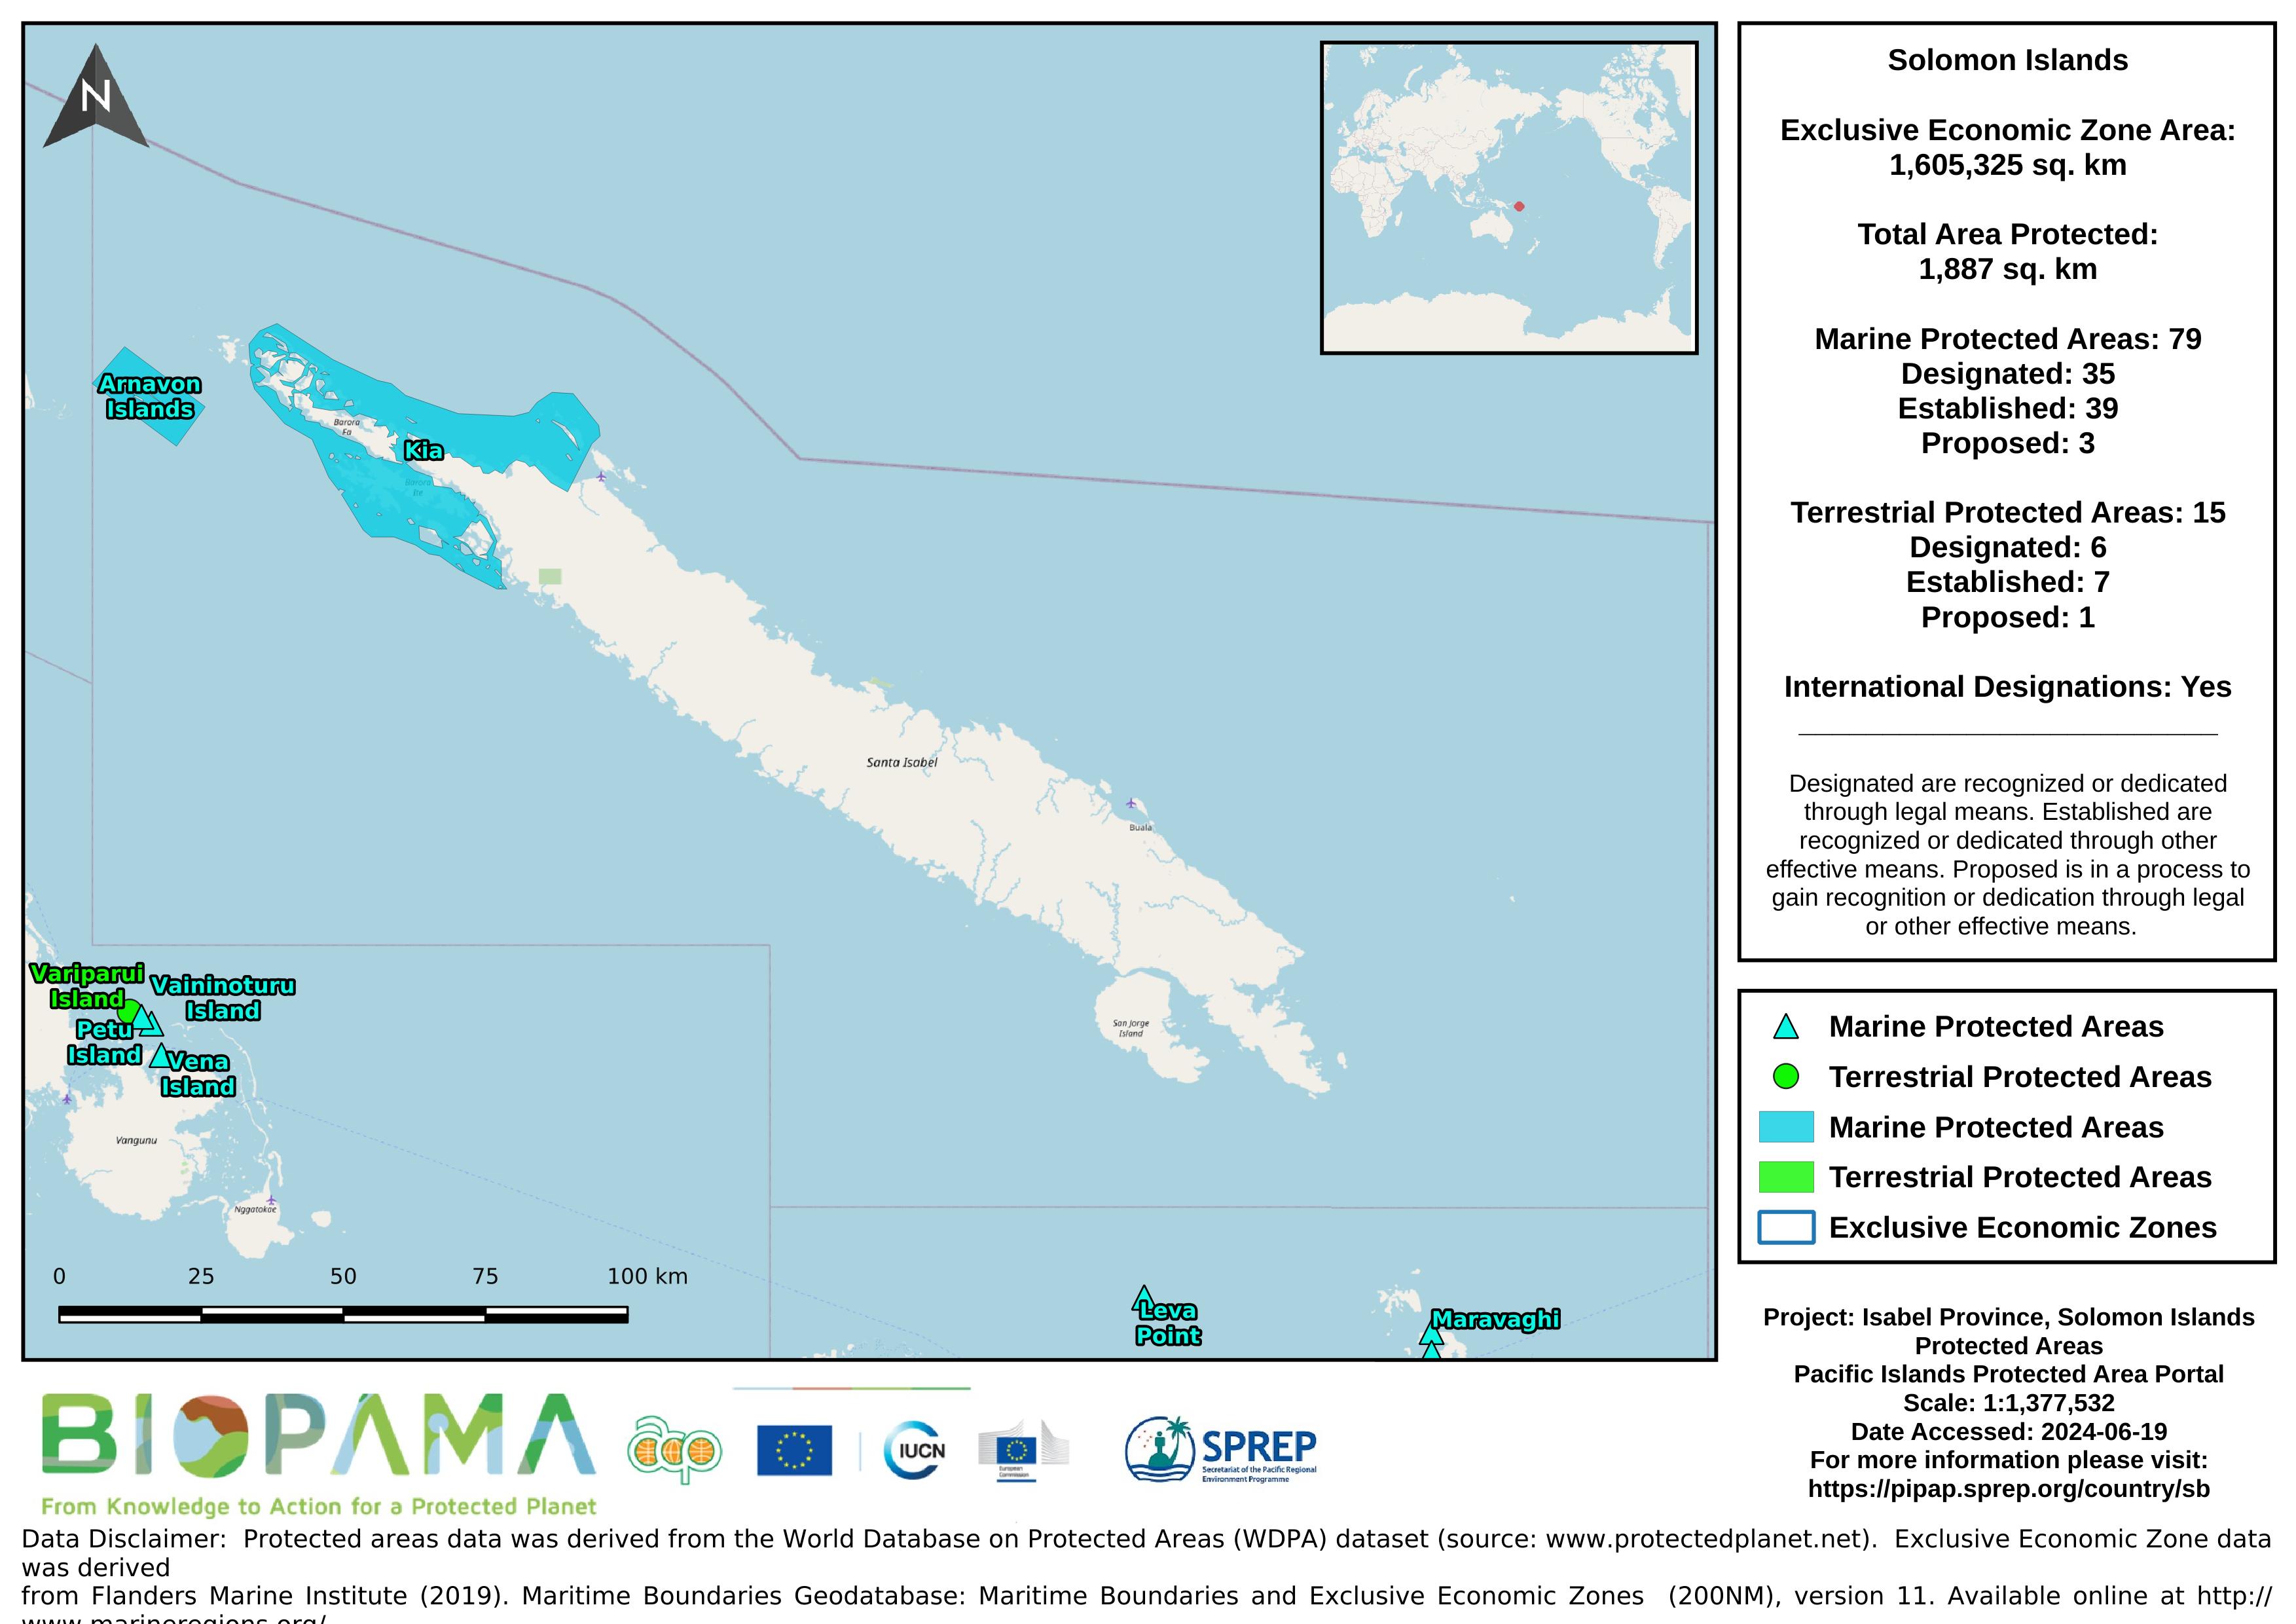
Map of the protected areas for Isabel province in the Solomon Islands with country-level summary statistics on the amount of area under protection, count for each type of protected area (terrestrial or marine), and the count of their designation.
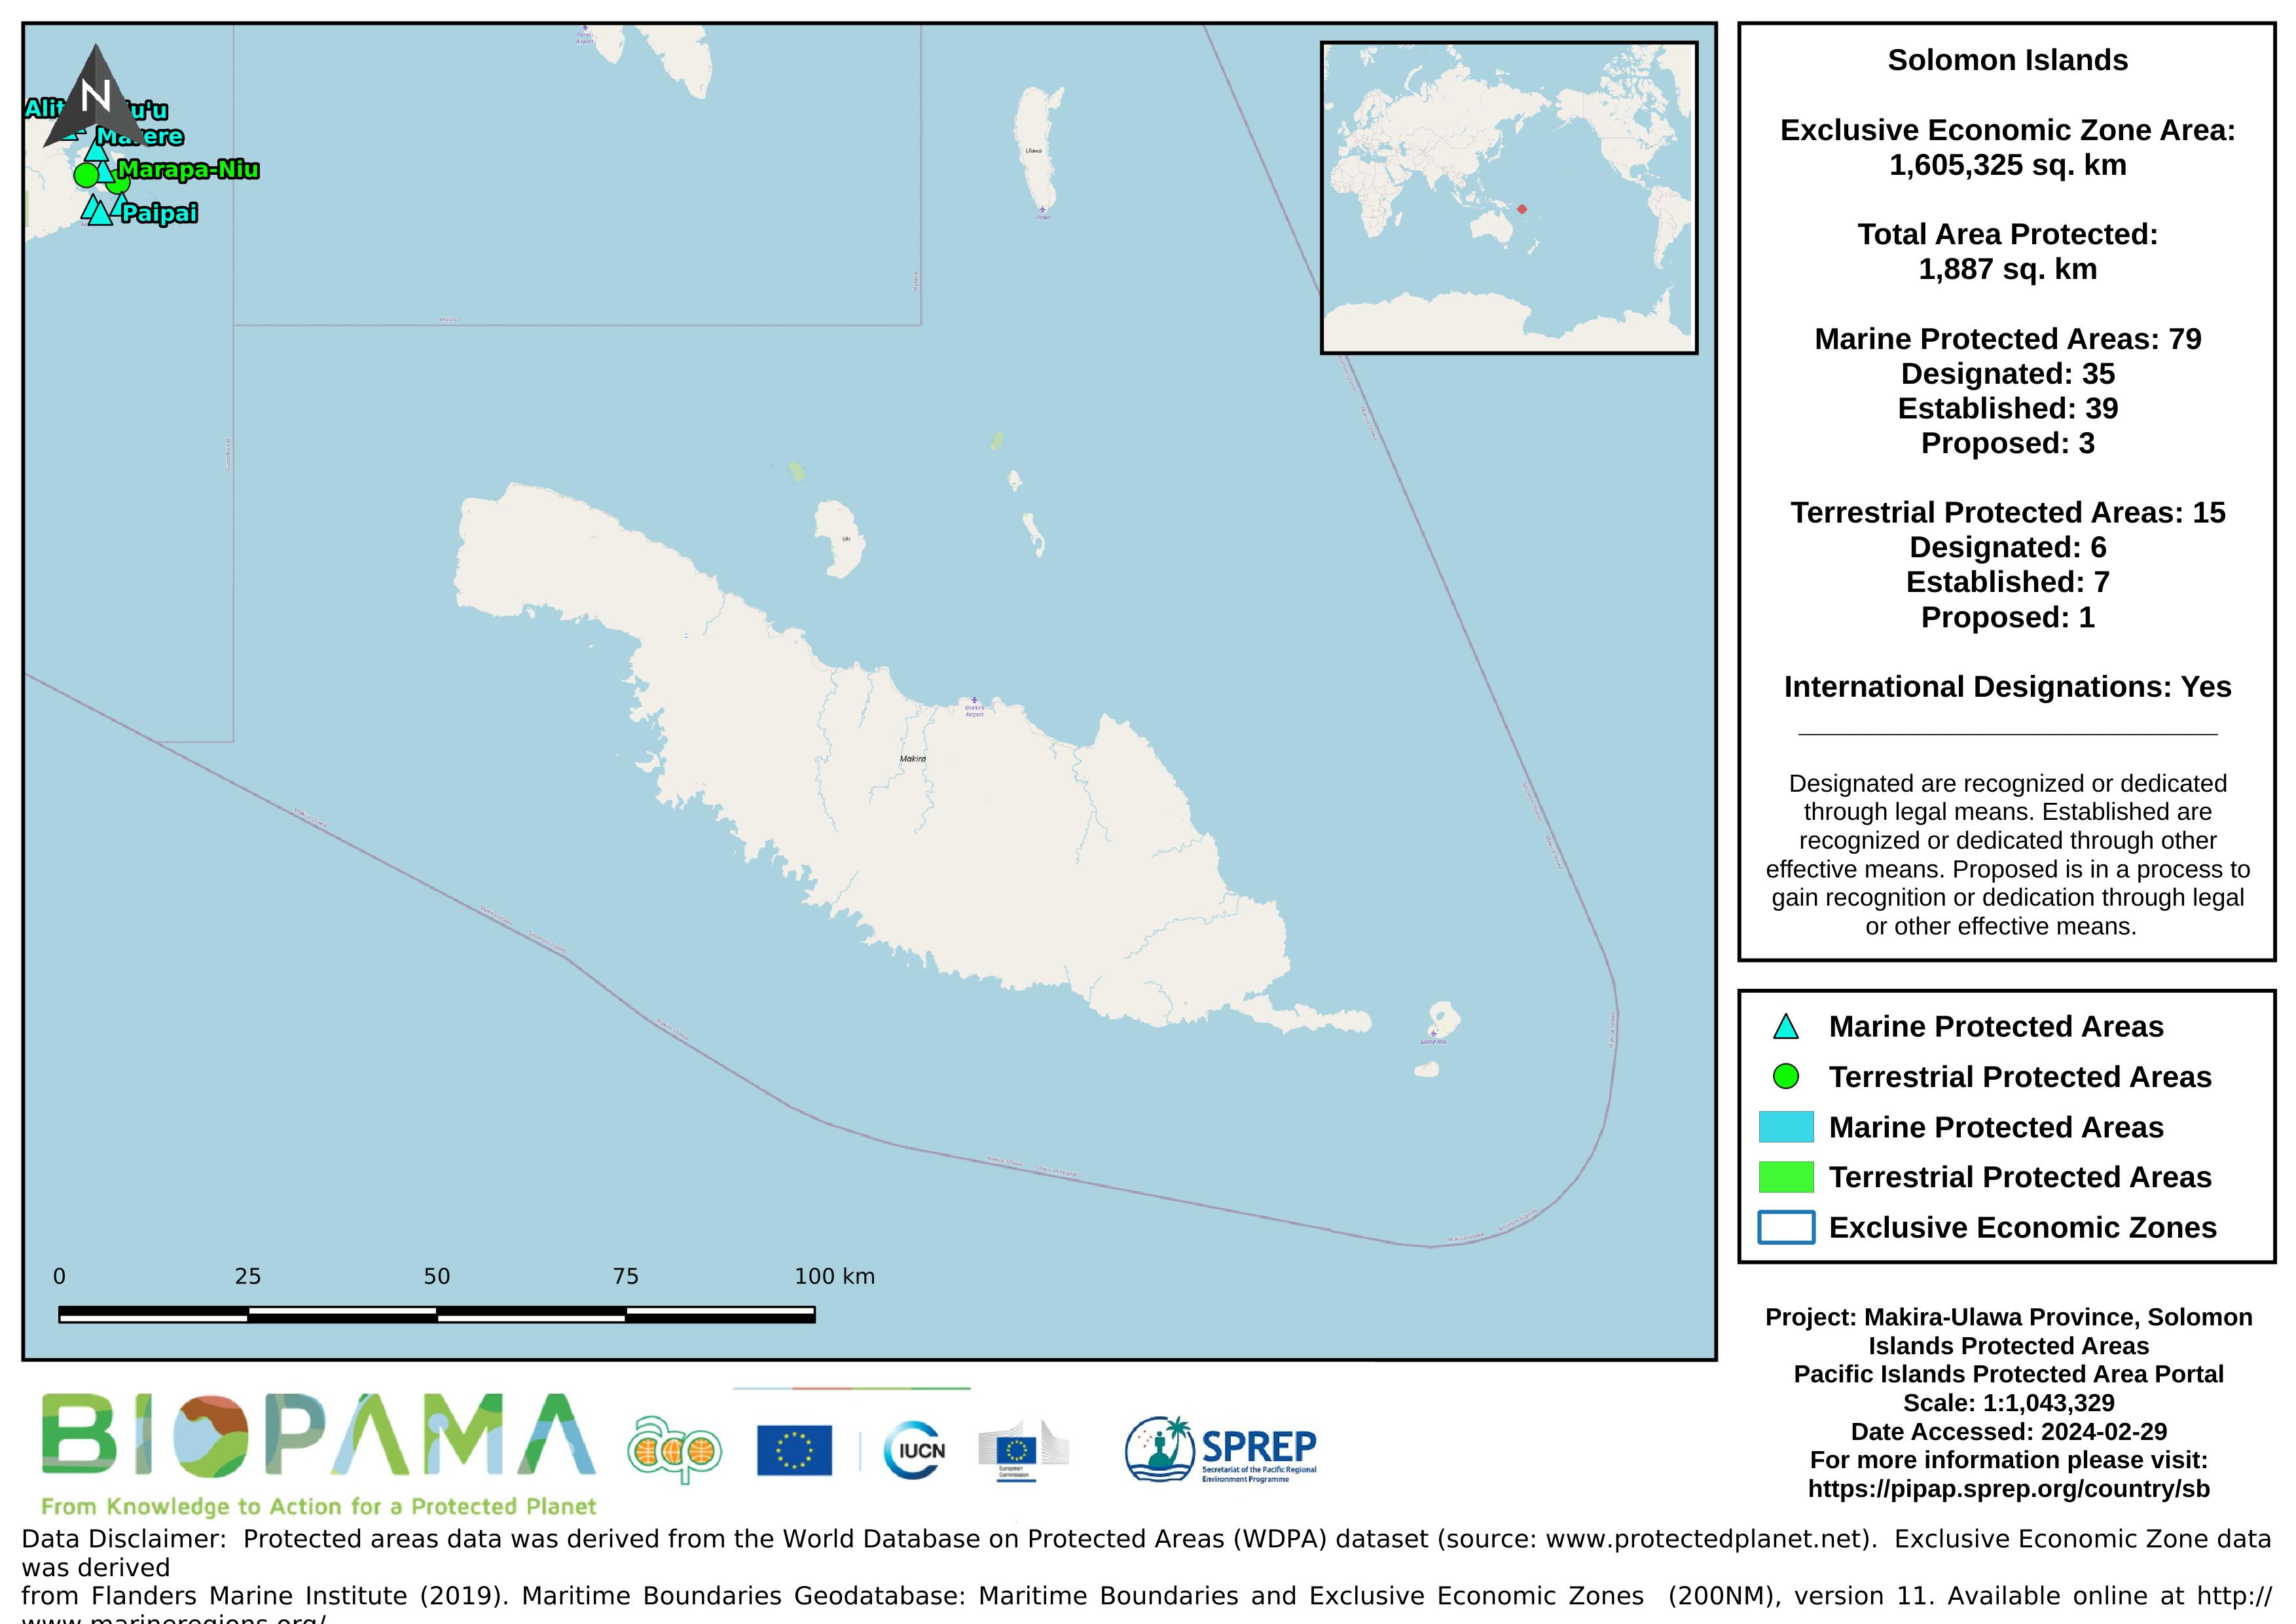
Map of the protected areas for Makira-Ulawa province in the Solomon Islands with country-level summary statistics on the amount of area under protection, count for each type of protected area (terrestrial or marine), and the count of their designation.
PowerPoint presentation on the building blocks and features of the environment data portals.
PowerPoint presentation with tips on good practices, when uploading data to the environment data portals.
Map of predictions of relative probabilities of species occurence in a global grid of half-degree latitude and longitude cell dimensions.
Map of predictions of relative probabilities of benthic marine species occurence in a global grid of half-degree latitude and longitude cell dimensions.
Map of predictions of relative probabilities of pelagic species occurence in a global grid of half-degree latitude and longitude cell dimensions.
Map of artisanal fishing intensity based on data from the global map of human impacts (2008) (https://www.nceas.ucsb.edu/globalmarine2008/impacts).
Map developed by MACBIO for the bioregions workshop 2018. Chlorophyl-a concentration is an important proxy which is routinely measured and is considered a "core" parameter of global physical-biological oceanic models. Map is based on data from NASA's Aqua satellite.
The map contains the global distribution of habitat suitability for seven suborders of cold water octocoral found deeper than 50m. Map is based on data from Yesson et al (2012) Global habitat suitability of cold water Octocorals, Journal of Biogeography 39, 1278-1292.