Map showing the different uses that put pressure on the marine environment. This includes among others vessel tracts, fisheries data, protected and restricted areas. Data sources are:
UNEP/CBD/EBSA/WSPAC/1/2. 2011. Compilation of Scientific Information to Describe EBSAs in the Western South Pacific Region.
KBAs: CEPF
DSM Tenements: Ministry of Lands and Survey, Solomon Islands
Shipping Routes: Solomon Islands Maritime and Ports Authority (SIPA)
Marine Managed Areas: CTAtlas
Vessel Tracks: Exact AIS
Map displaying tree cover loss with > 30% canopy density, between 2001-2018. Tree cover loss is not always deforestation. Global Forest Watch data.
This is an example map from the Solomon Islands Marine Atlas. A series of maps from the Marine Atlas are uploaded as separate datasets to this portal. Use the search box or filter by the keyword/tag "maps".
he 33 deepwater bioregions for the Solomon Islands were condensed into 26 bioregions. The major changes were made to the northwestern side of the Solomon Islands EEZ; there was general agreement about the deepwater bioregions in the southeastern half of the country. Bioregions 120, 164, 167, 192, 244, and 304 were merged with Bioregion 222. Bioregion 226 was split into two halves, and one part of the non-contiguous Bioregion 240 (the part closer to the islands) was merged with 222.
reef-associated bioregions for the Solomon Islands
Indication of location for the establishment of the Barana and Queen Elizabeth Park to improve the upper Mataniko and Lungga catchment area’s provision of fresh water supply and other ecosystem services.
*refer to Honiara Ecosystem Based Adaptation Option Assessment report for more detailed information*
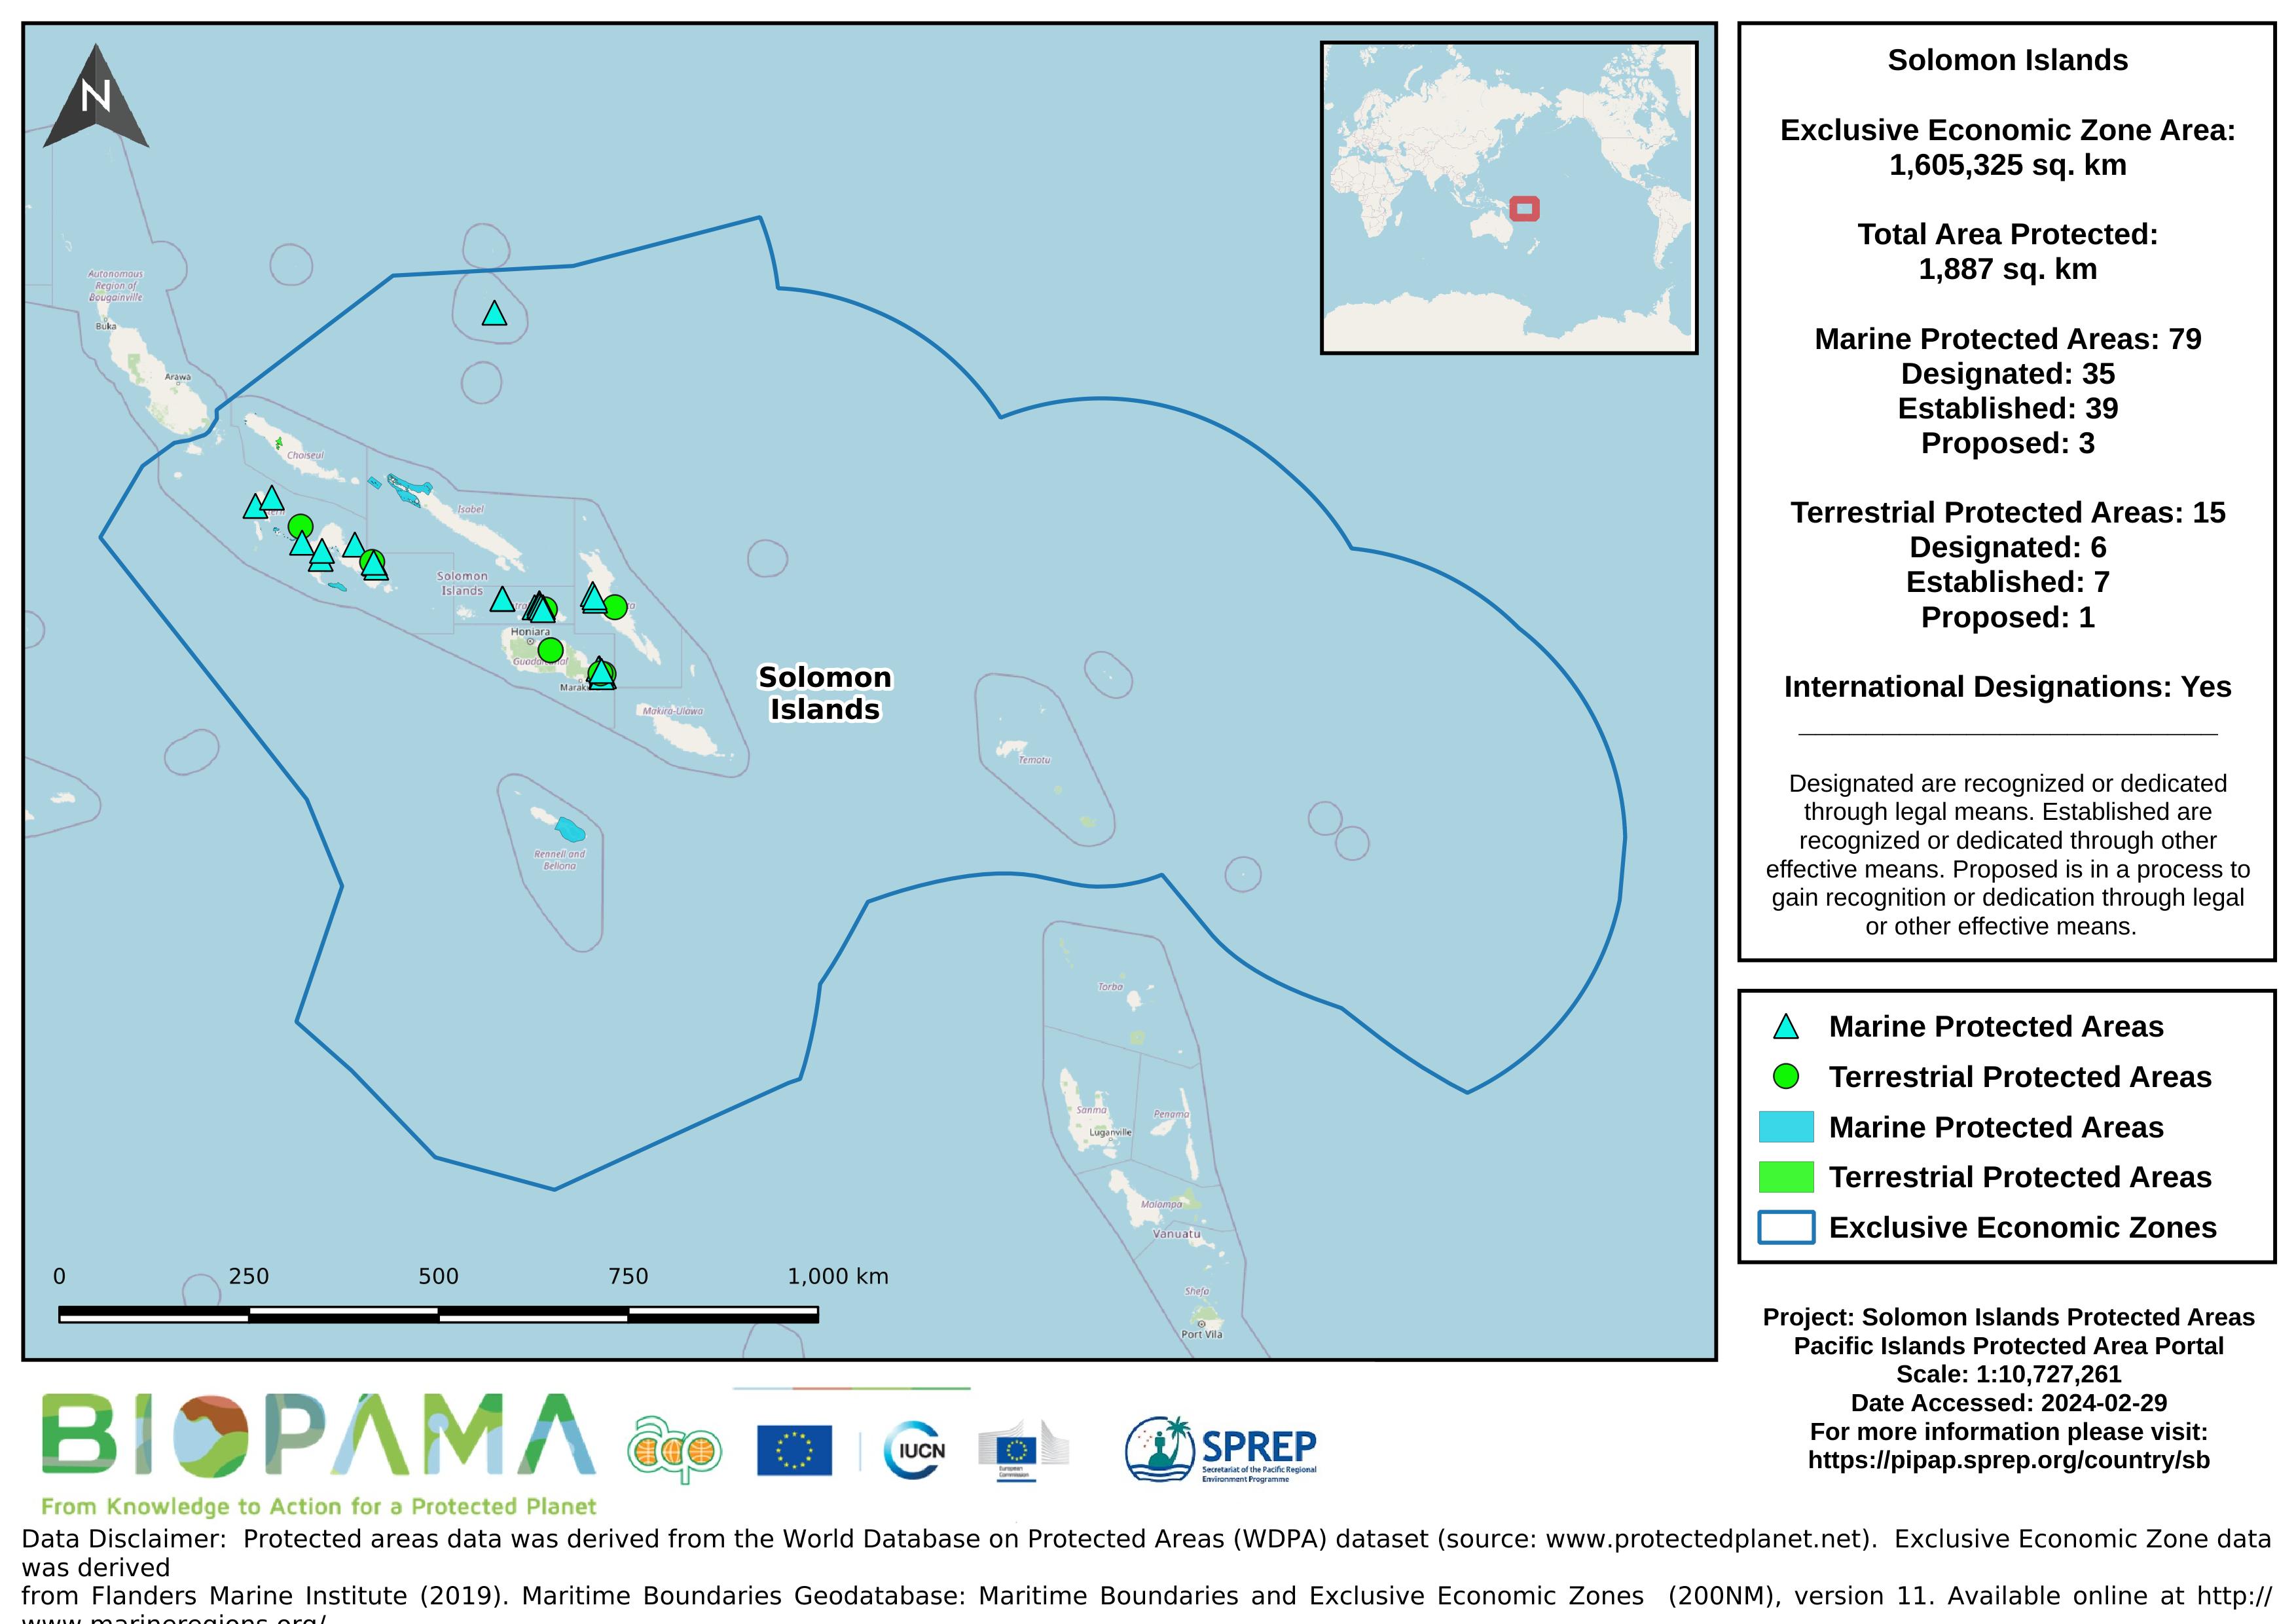
Map of the protected areas for the Solomon Islands with country-level summary statistics on the amount of area under protection, count for each type of protected area (terrestrial or marine), and the count of their designation.
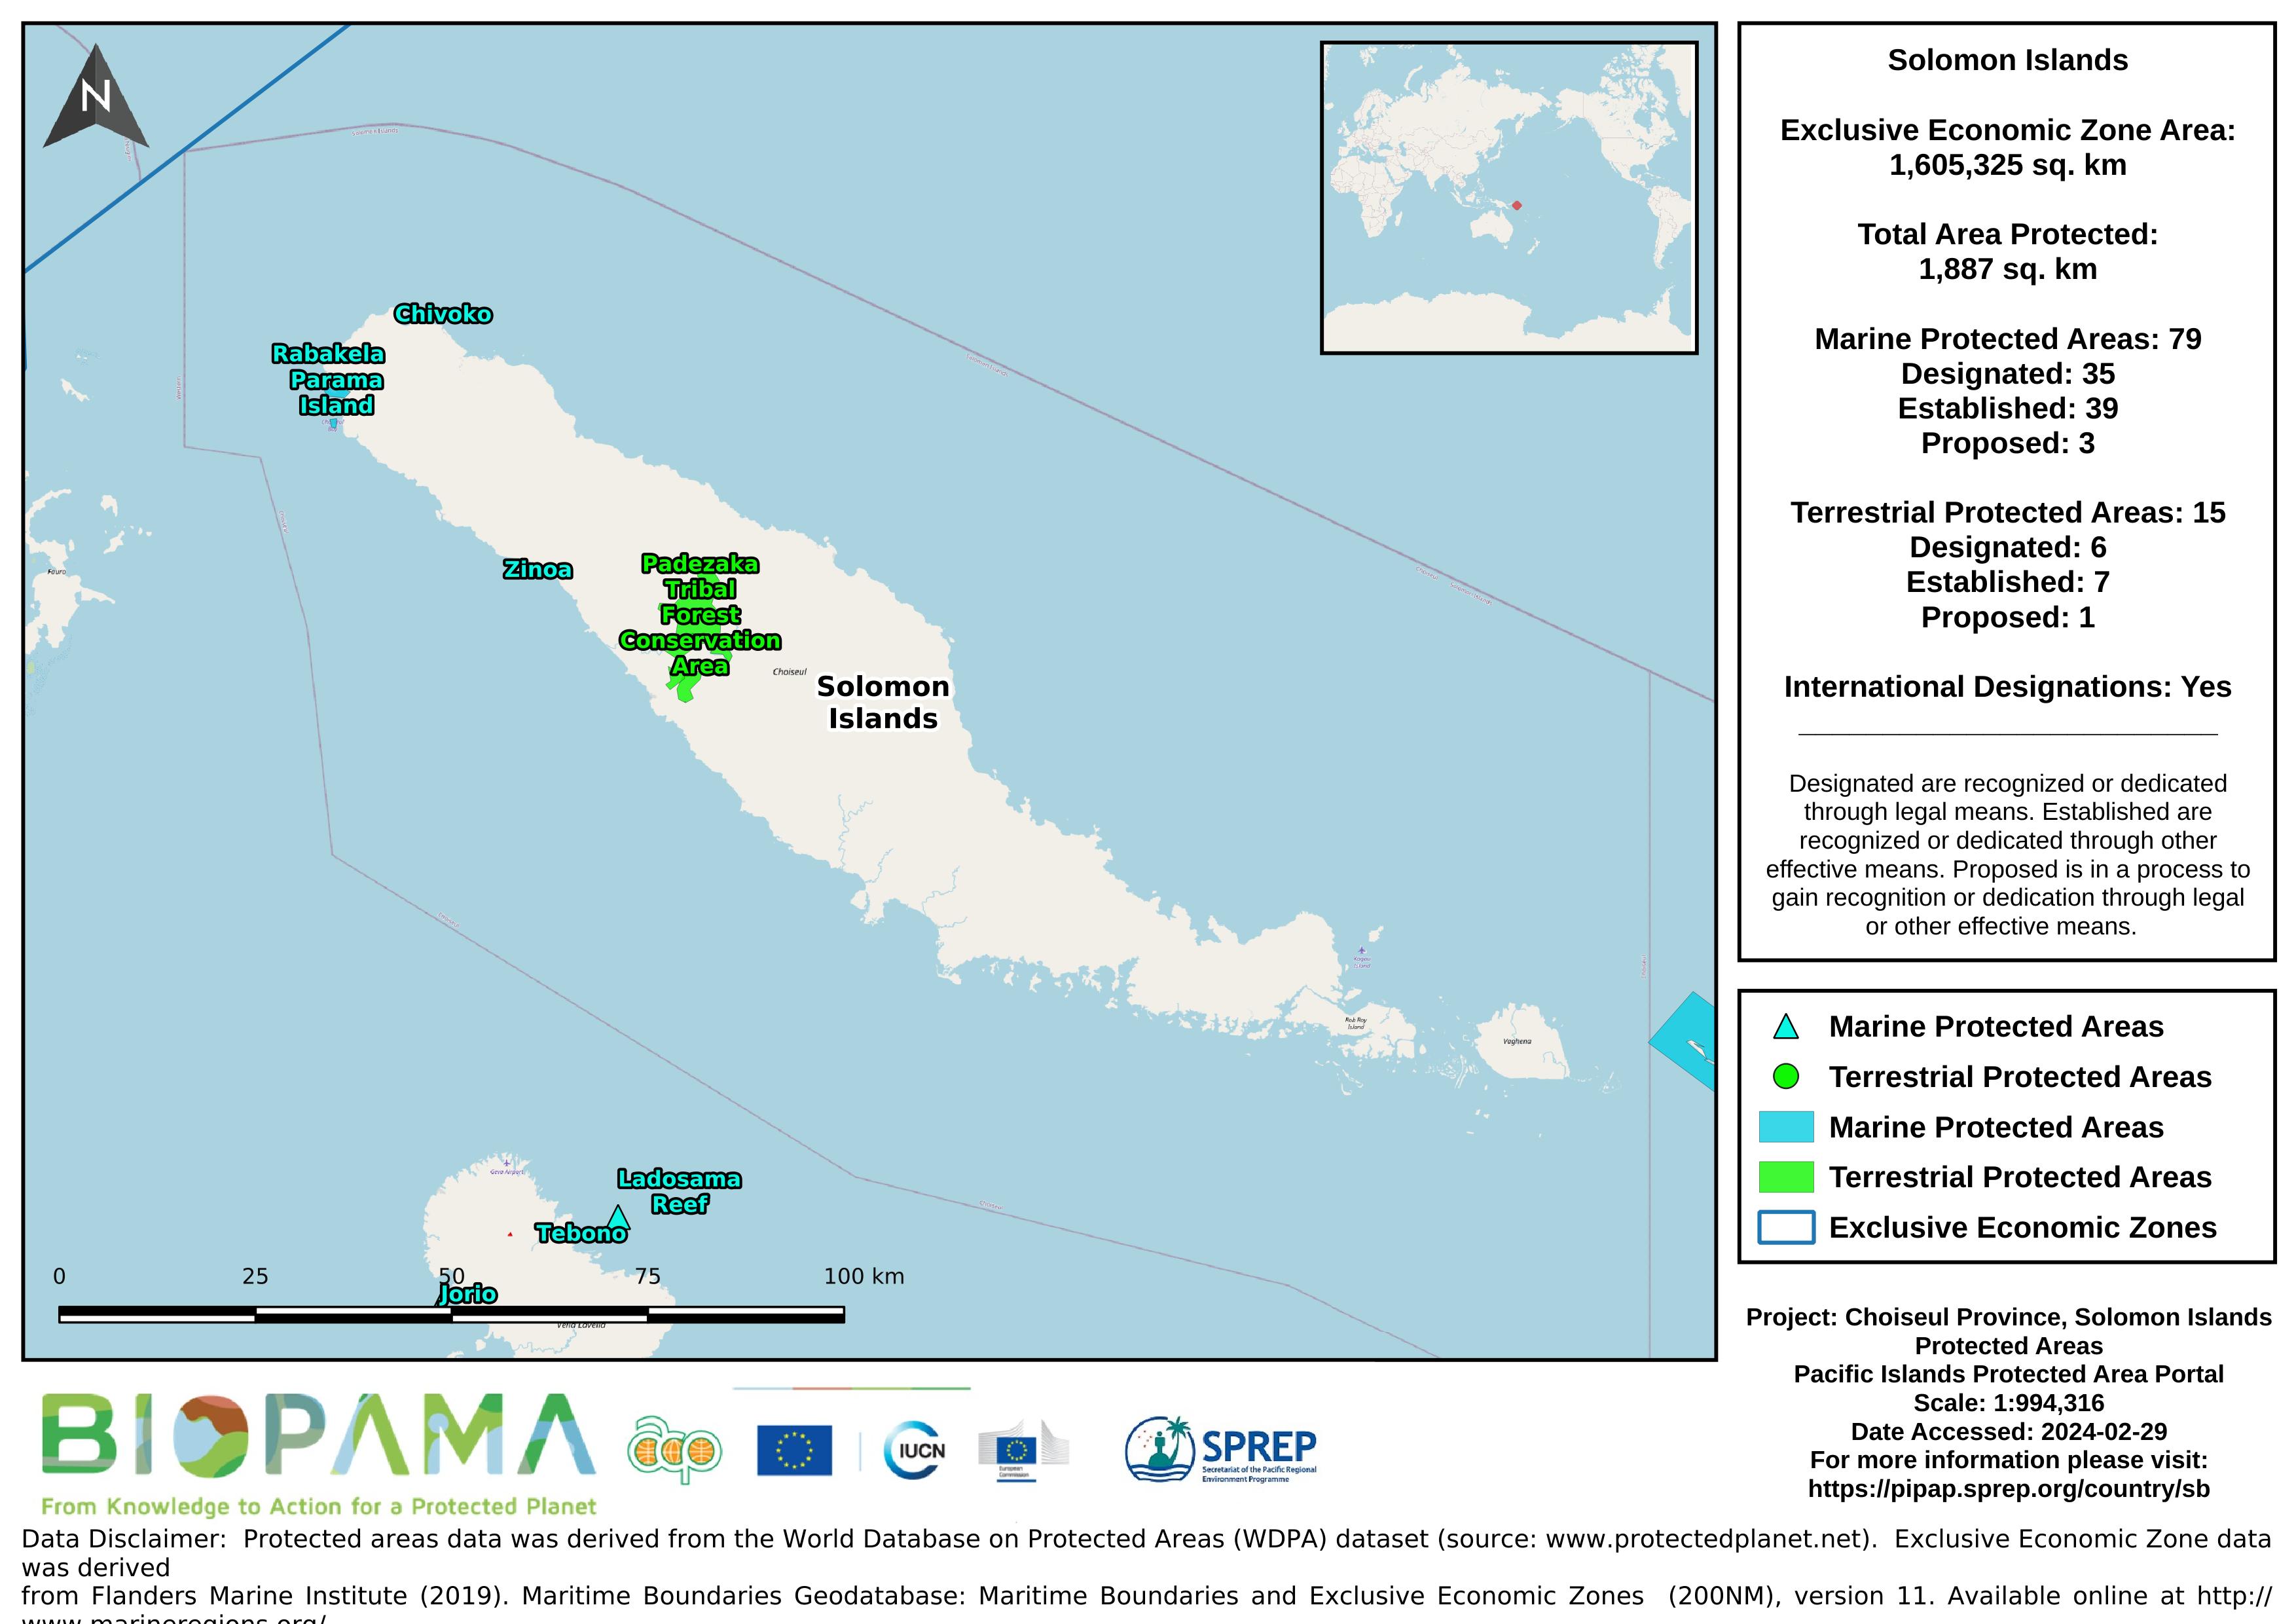
Map of the protected areas for Choiseul province in the Solomon Islands with country-level summary statistics on the amount of area under protection, count for each type of protected area (terrestrial or marine), and the count of their designation.
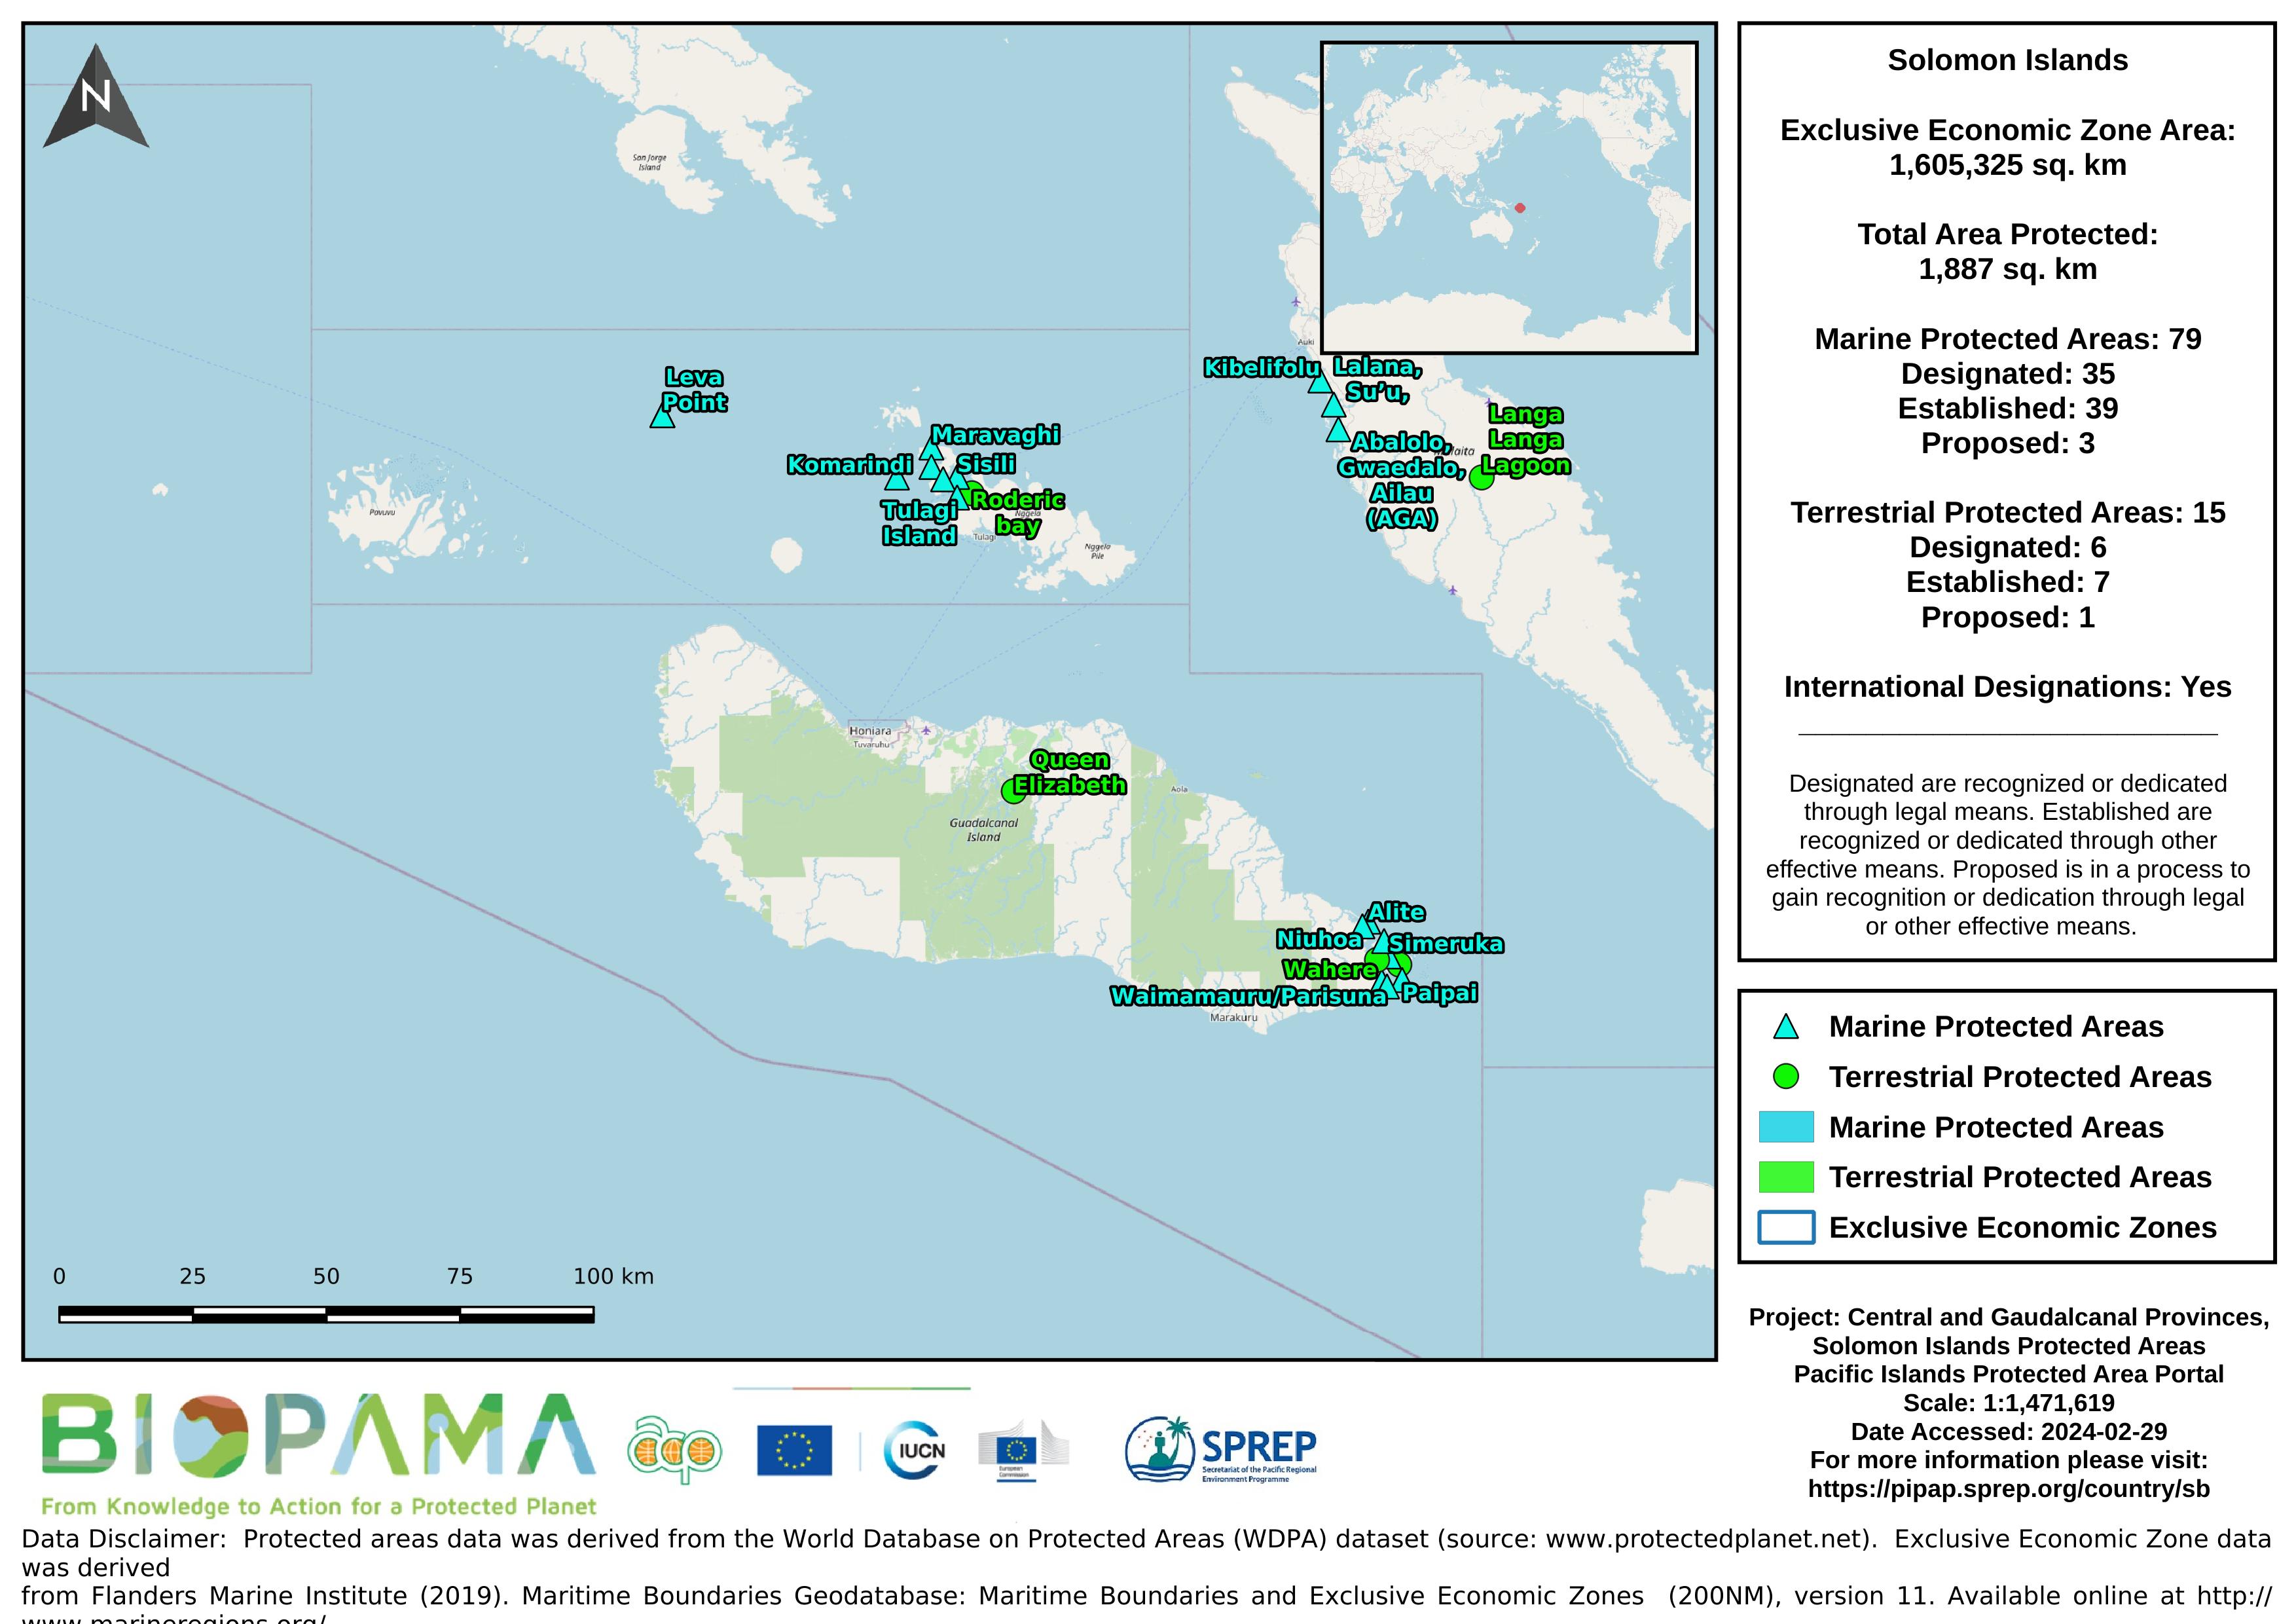
Map of the protected areas for Guadalcanal and Central provinces in the Solomon Islands with country-level summary statistics on the amount of area under protection, count for each type of protected area (terrestrial or marine), and the count of their designation.
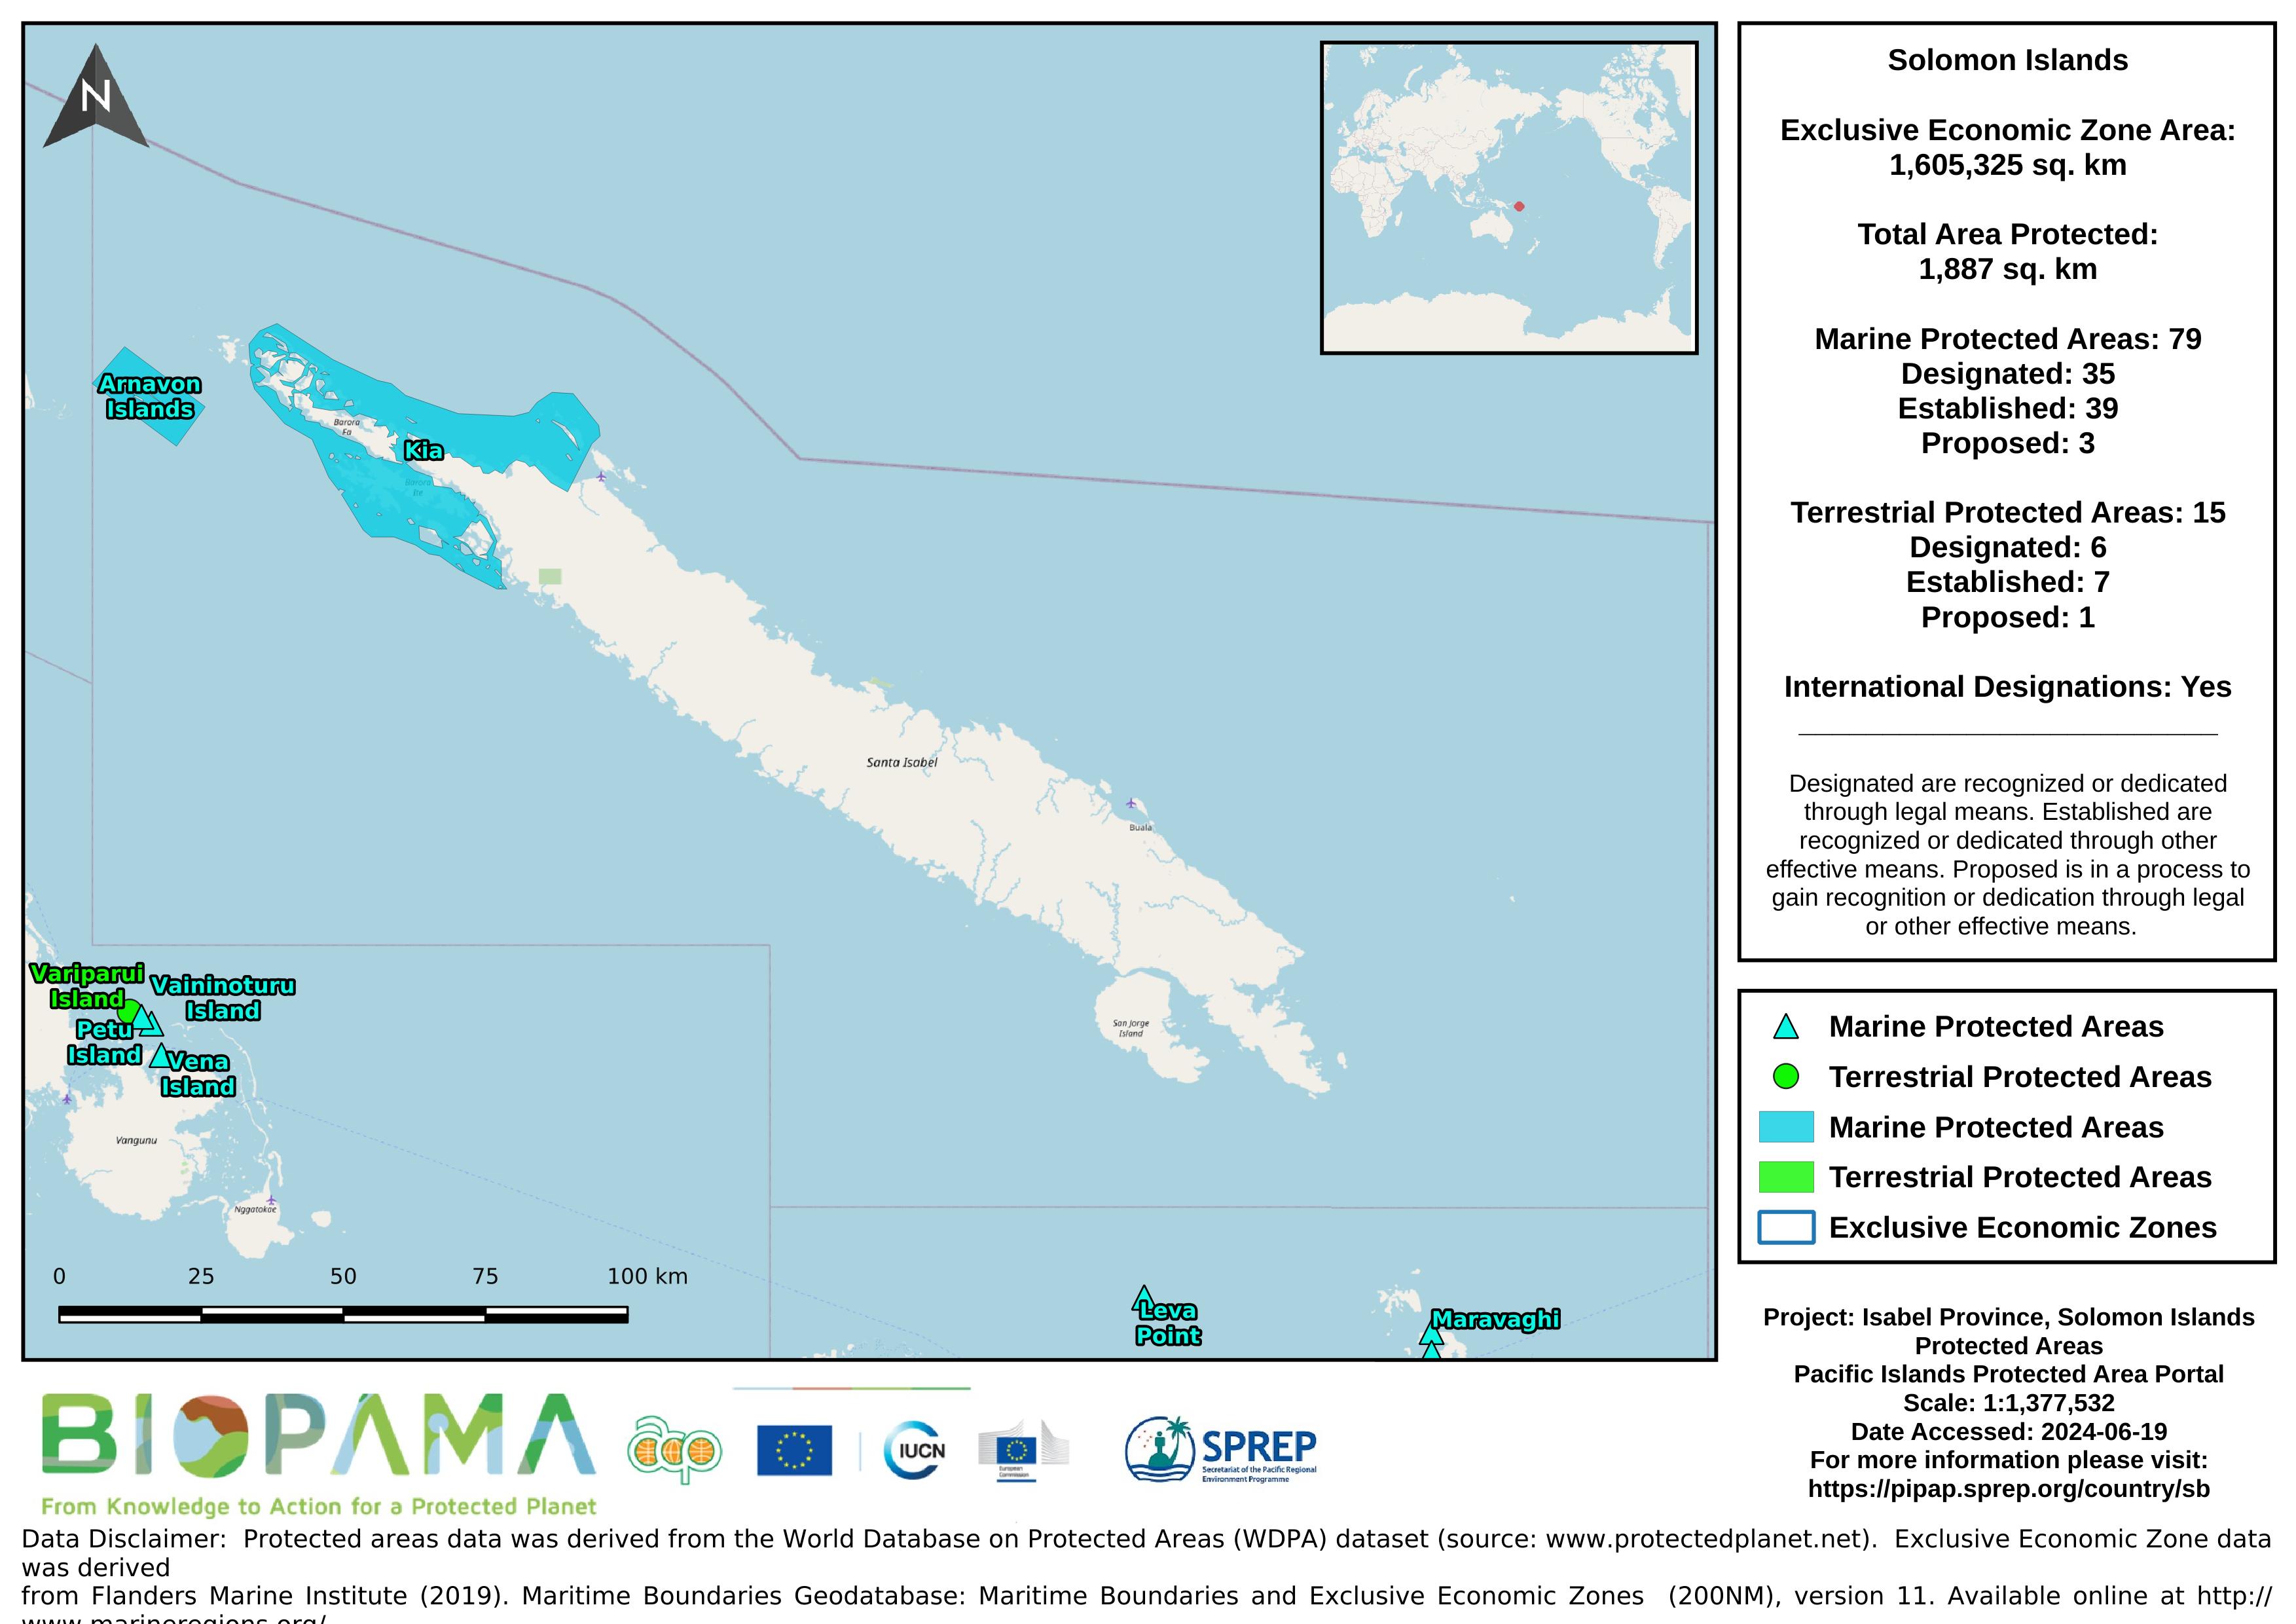
Map of the protected areas for Isabel province in the Solomon Islands with country-level summary statistics on the amount of area under protection, count for each type of protected area (terrestrial or marine), and the count of their designation.
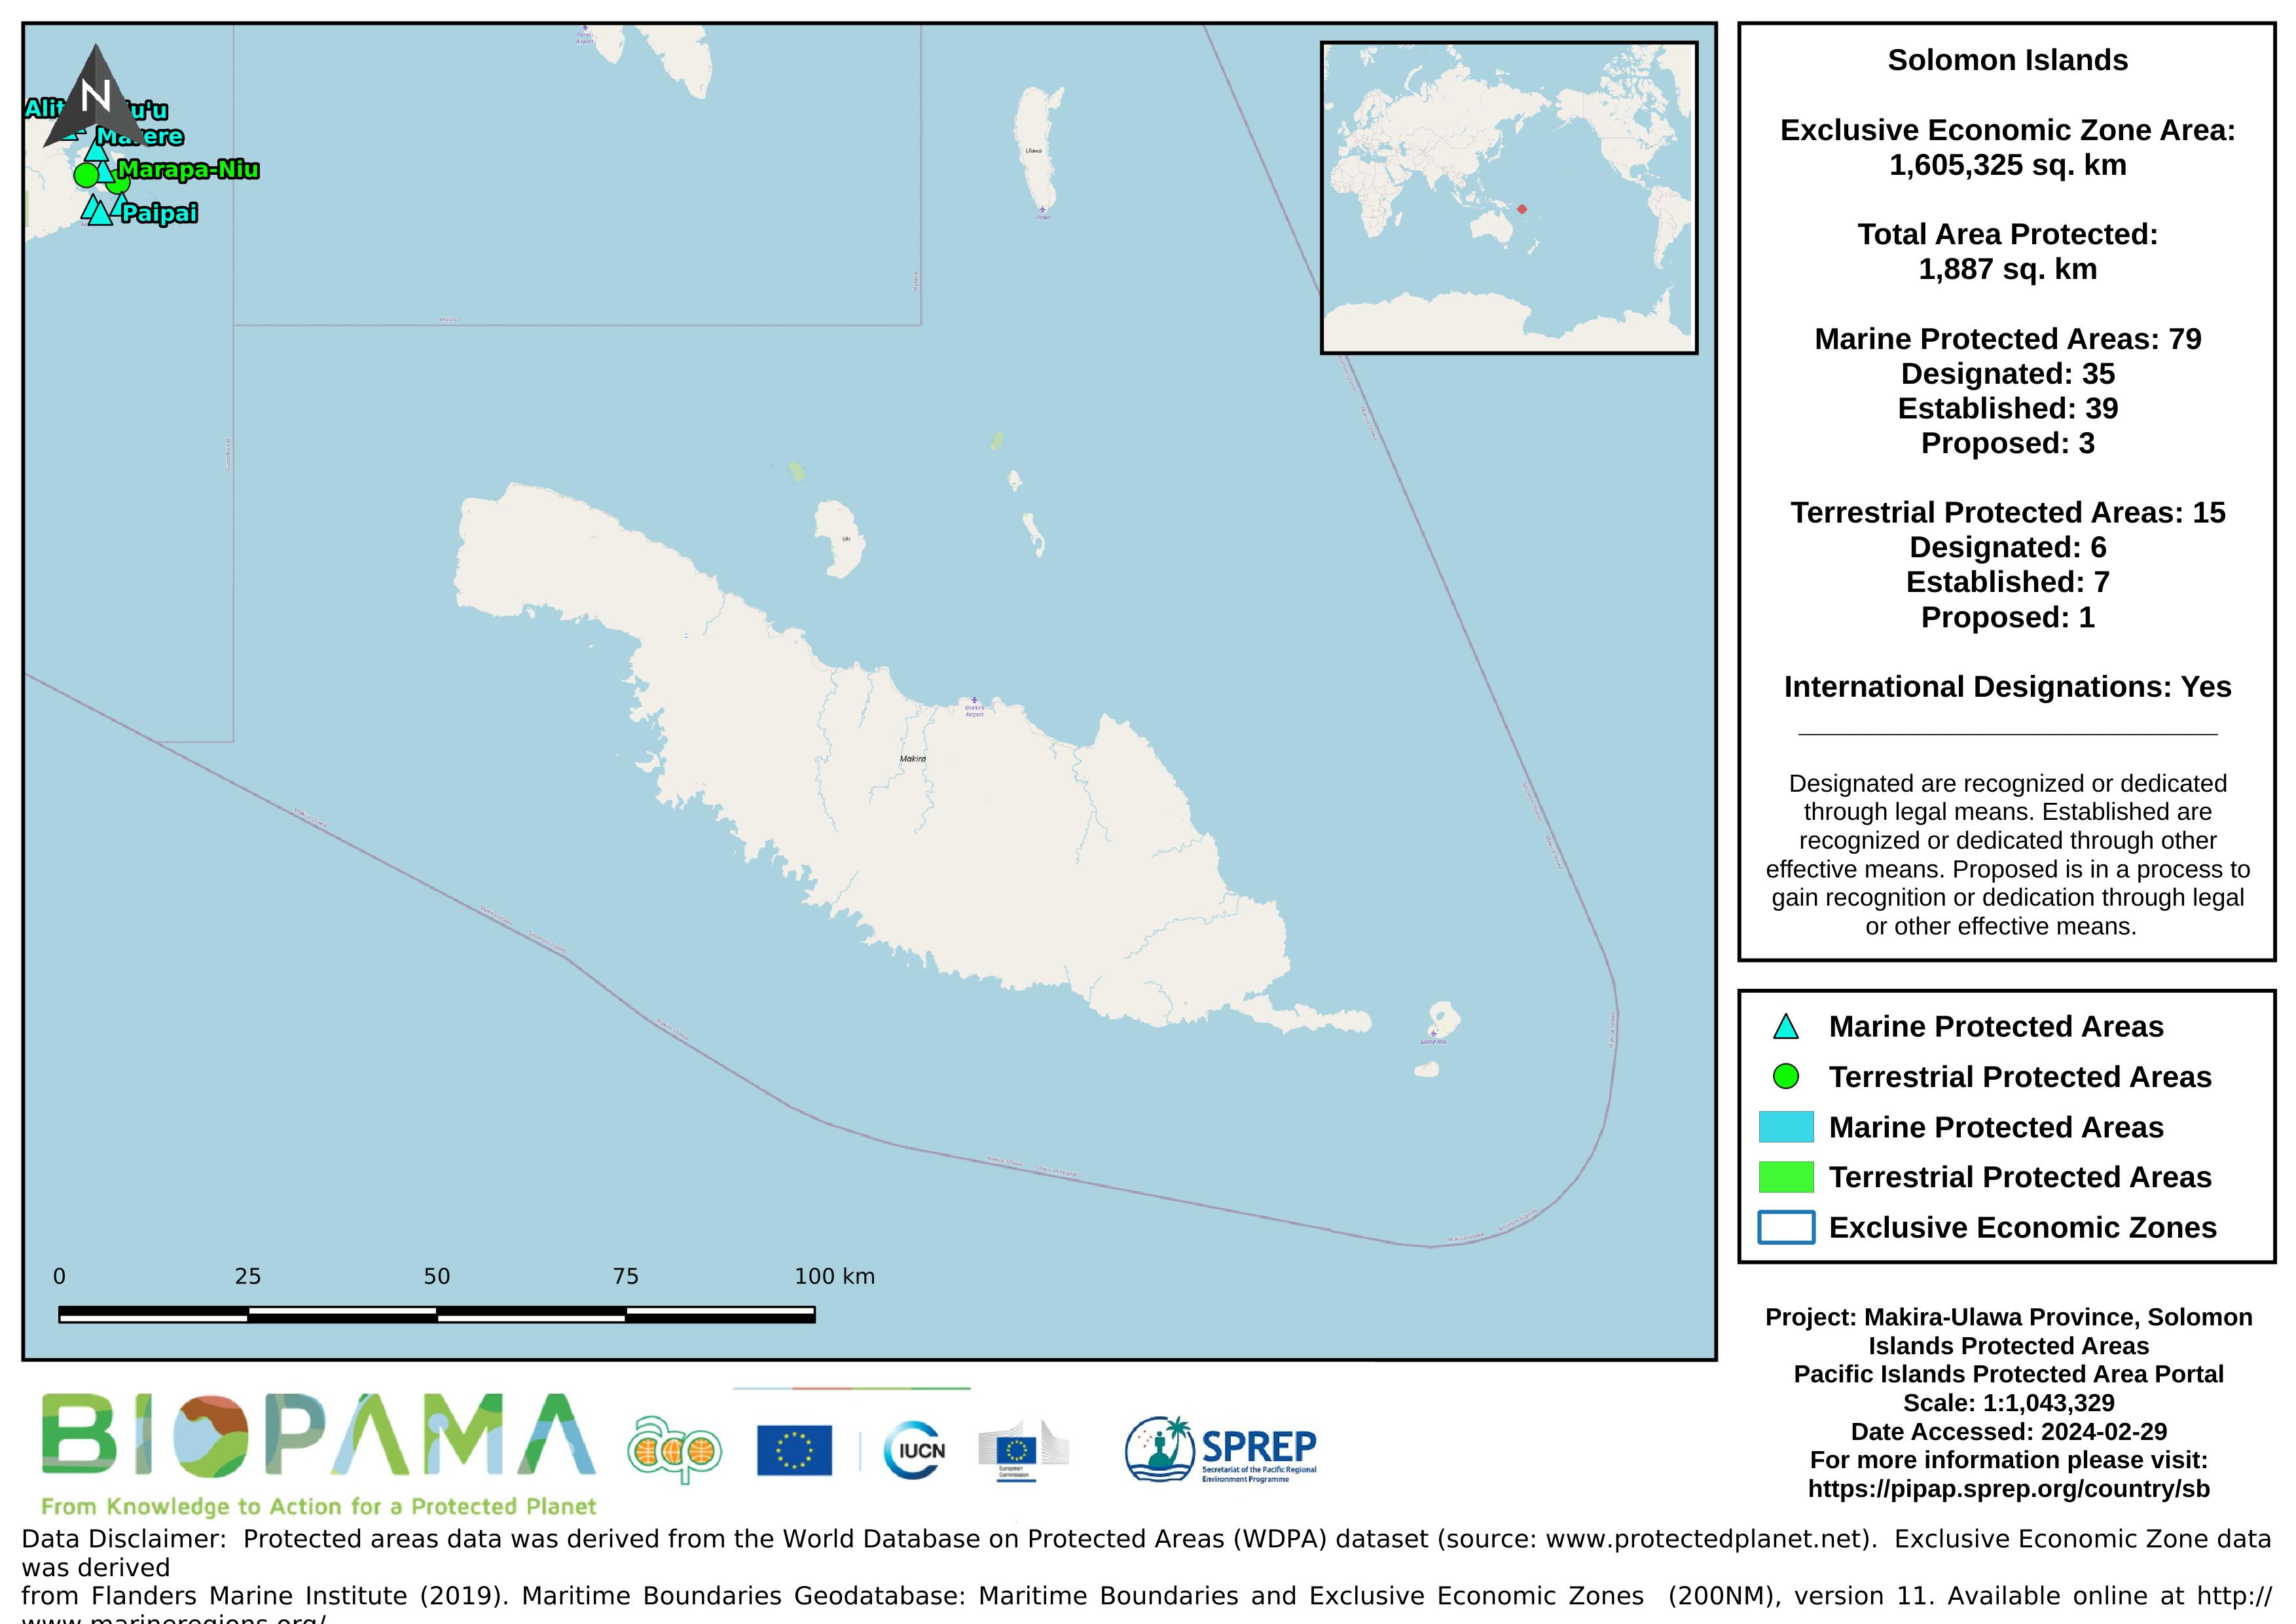
Map of the protected areas for Makira-Ulawa province in the Solomon Islands with country-level summary statistics on the amount of area under protection, count for each type of protected area (terrestrial or marine), and the count of their designation.
GEBCO’s gridded bathymetric data set, the GEBCO_2020 grid, is a global terrain model for ocean and land at 15 arc-second intervals. It is accompanied by a Type Identifier (TID) Grid that gives information on the types of source data that the GEBCO_2020 Grid is based.
If the data sets are used in a presentation or publication then we ask that you acknowledge the source.This should be of the form: GEBCO Compilation Group (2020) GEBCO 2020 Grid (doi:10.5285/a29c5465-b138-234d-e053-6c86abc040b9)
Raster data representing the mean levels of chlorophyll in mg/m3 for the surface water layer. The data are available for global-scale applications at a spatial resolution of 5 arcmin (approximately 9.2 km at the equator).
Marine data layers for present conditions were produced with climate data describing monthly averages for the period 2000–2014, obtained from pre-processed global ocean re-analyses combining satellite and in situ observations at regular two- and three-dimensional spatial grids.
Raster data representing the mean levels of dissolved oxygen in µmol/m3 for the surface water layer. The data are available for global-scale applications at a spatial resolution of 5 arcmin (approximately 9.2 km at the equator).
Marine data layers for present conditions were produced with climate data describing monthly averages for the period 2000–2014, obtained from pre-processed global ocean re-analyses combining satellite and in situ observations at regular two- and three-dimensional spatial grids.
Raster data representing the mean levels of nitrate in µmol/m3 for the surface water layer. The data are available for global-scale applications at a spatial resolution of 5 arcmin (approximately 9.2 km at the equator).
Marine data layers for present conditions were produced with climate data describing monthly averages for the period 2000–2014, obtained from pre-processed global ocean re-analyses combining satellite and in situ observations at regular two- and three-dimensional spatial grids.
Raster data representing the mean levels of phosphate in µmol/m3 for the surface water layer. The data are available for global-scale applications at a spatial resolution of 5 arcmin (approximately 9.2 km at the equator).
Marine data layers for present conditions were produced with climate data describing monthly averages for the period 2000–2014, obtained from pre-processed global ocean re-analyses combining satellite and in situ observations at regular two- and three-dimensional spatial grids.
Raster data representing the mean levels of phytoplankton in µmol/m3 for the surface water layer. The data are available for global-scale applications at a spatial resolution of 5 arcmin (approximately 9.2 km at the equator).
Marine data layers for present conditions were produced with climate data describing monthly averages for the period 2000–2014, obtained from pre-processed global ocean re-analyses combining satellite and in situ observations at regular two- and three-dimensional spatial grids.