reef-associated bioregions for the Solomon Islands
Indication of location for the establishment of the Barana and Queen Elizabeth Park to improve the upper Mataniko and Lungga catchment area’s provision of fresh water supply and other ecosystem services.
*refer to Honiara Ecosystem Based Adaptation Option Assessment report for more detailed information*
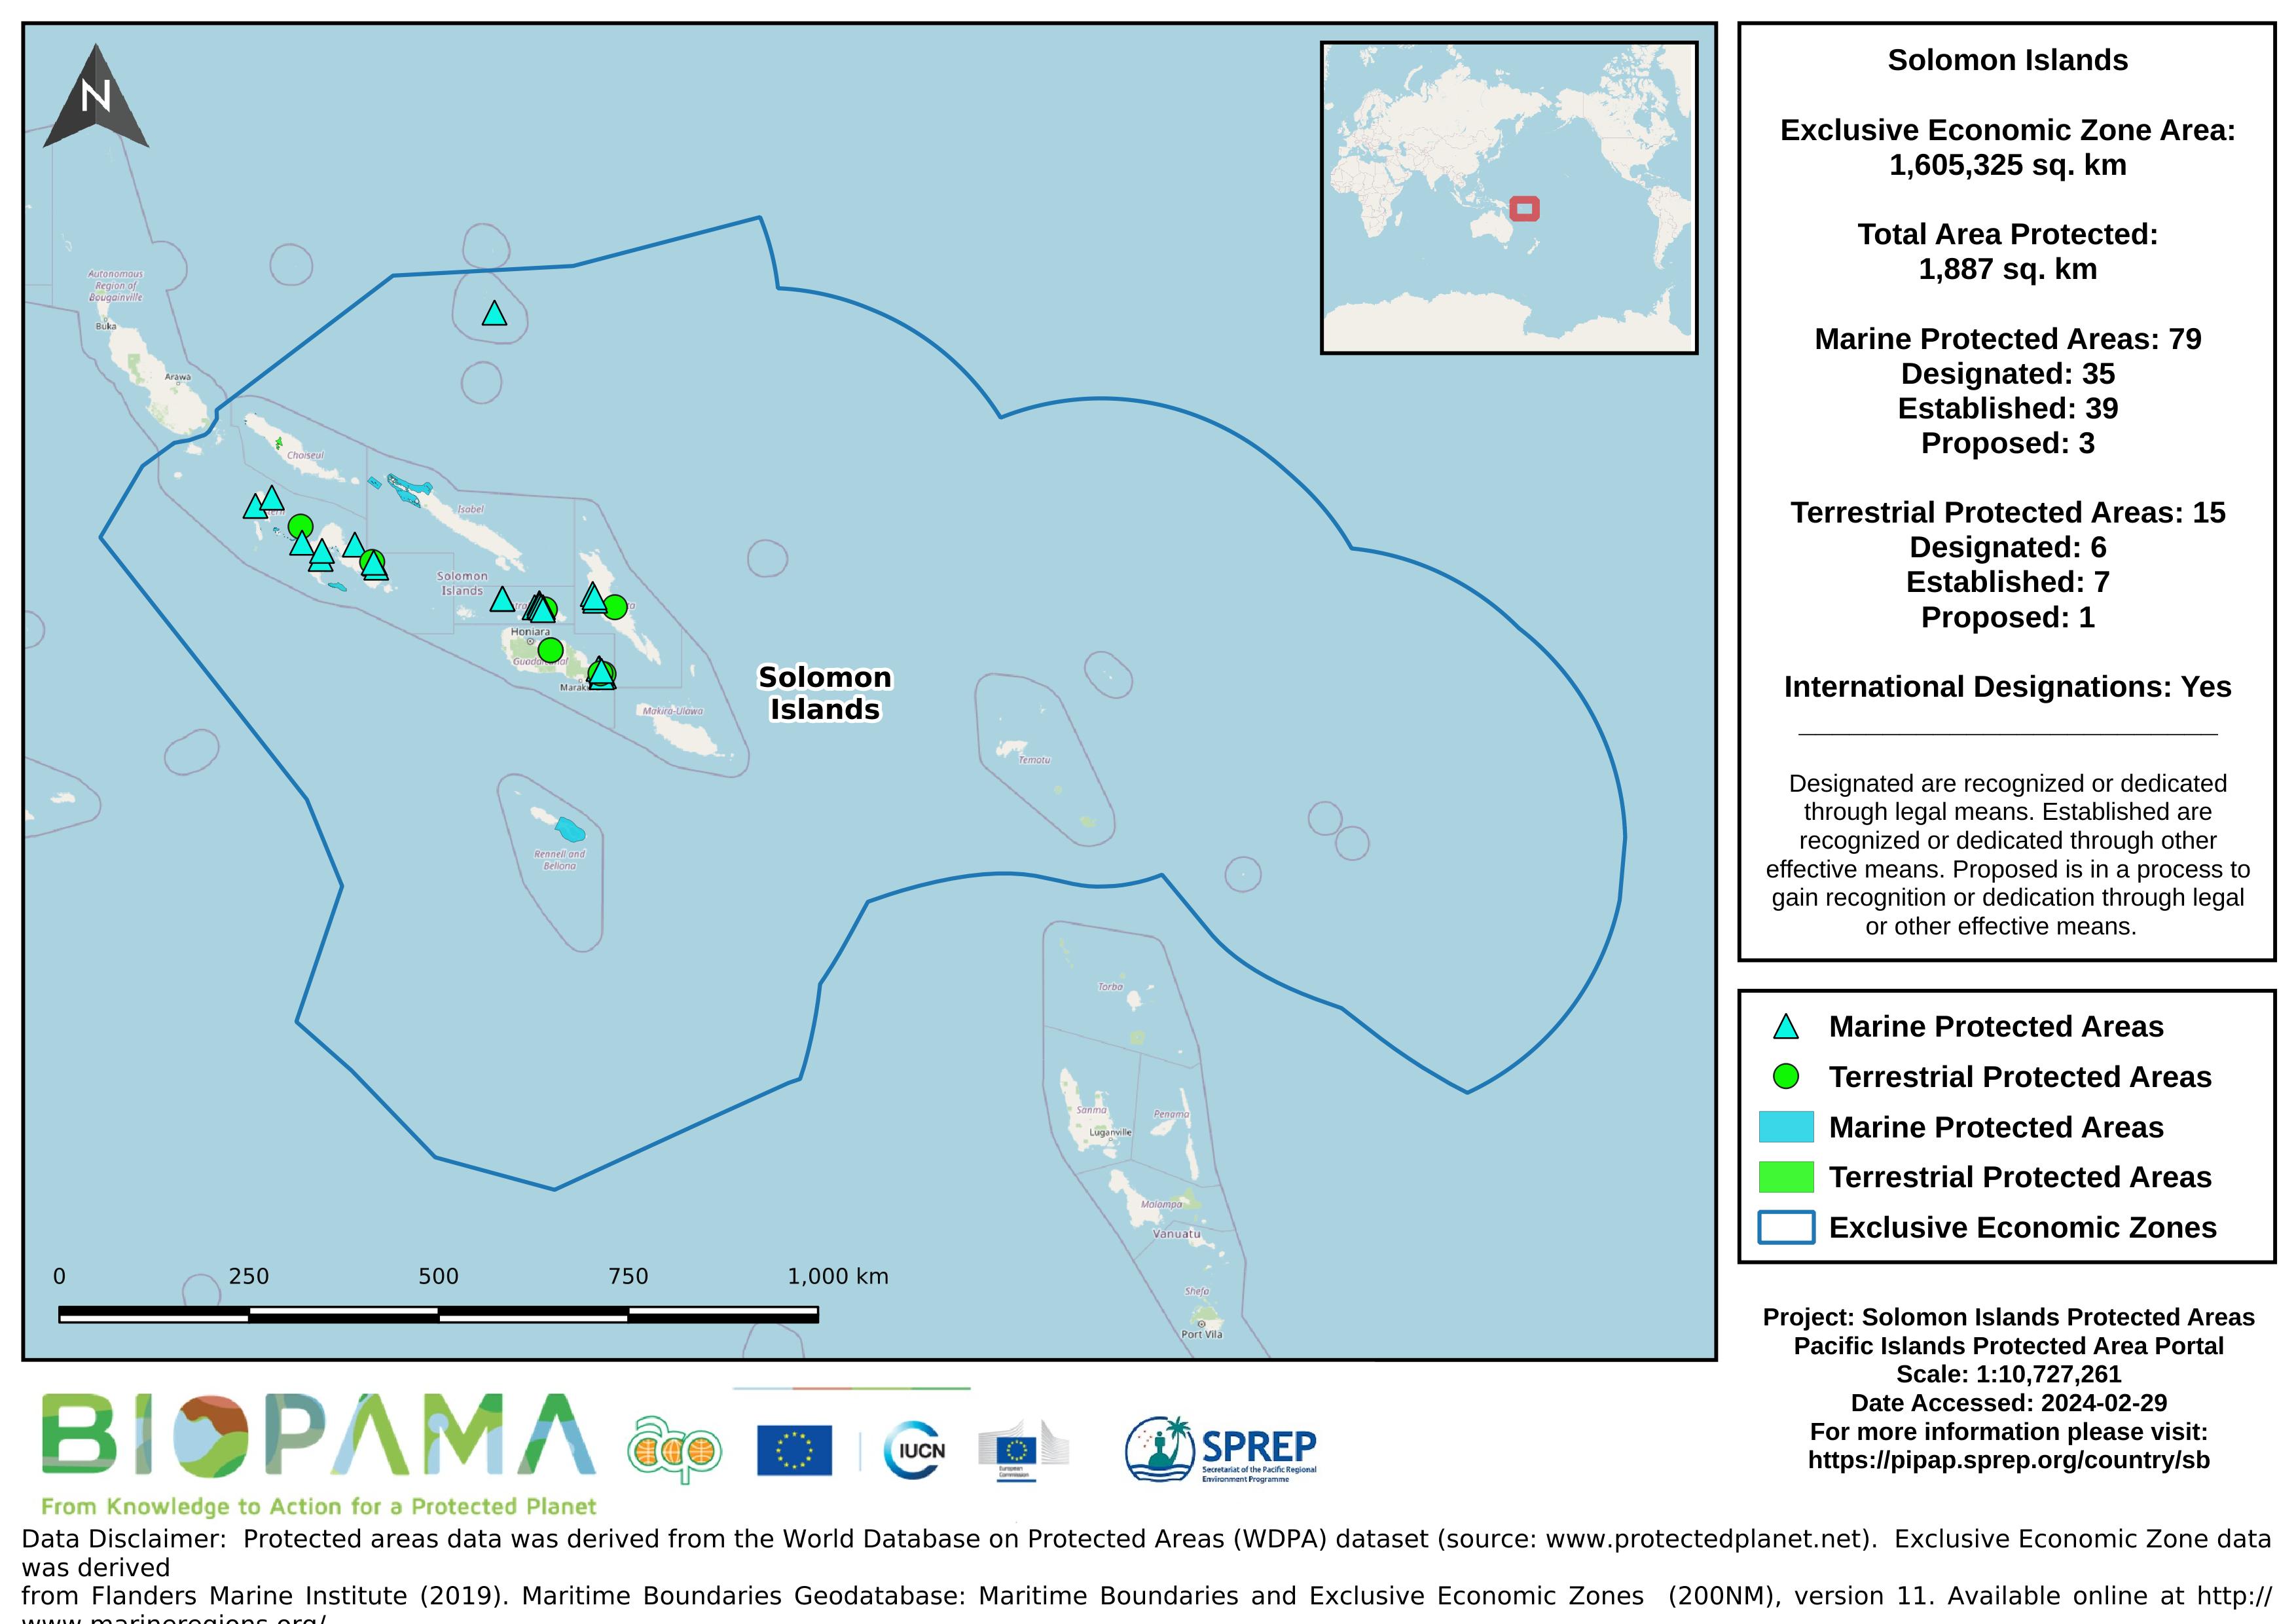
Map of the protected areas for the Solomon Islands with country-level summary statistics on the amount of area under protection, count for each type of protected area (terrestrial or marine), and the count of their designation.
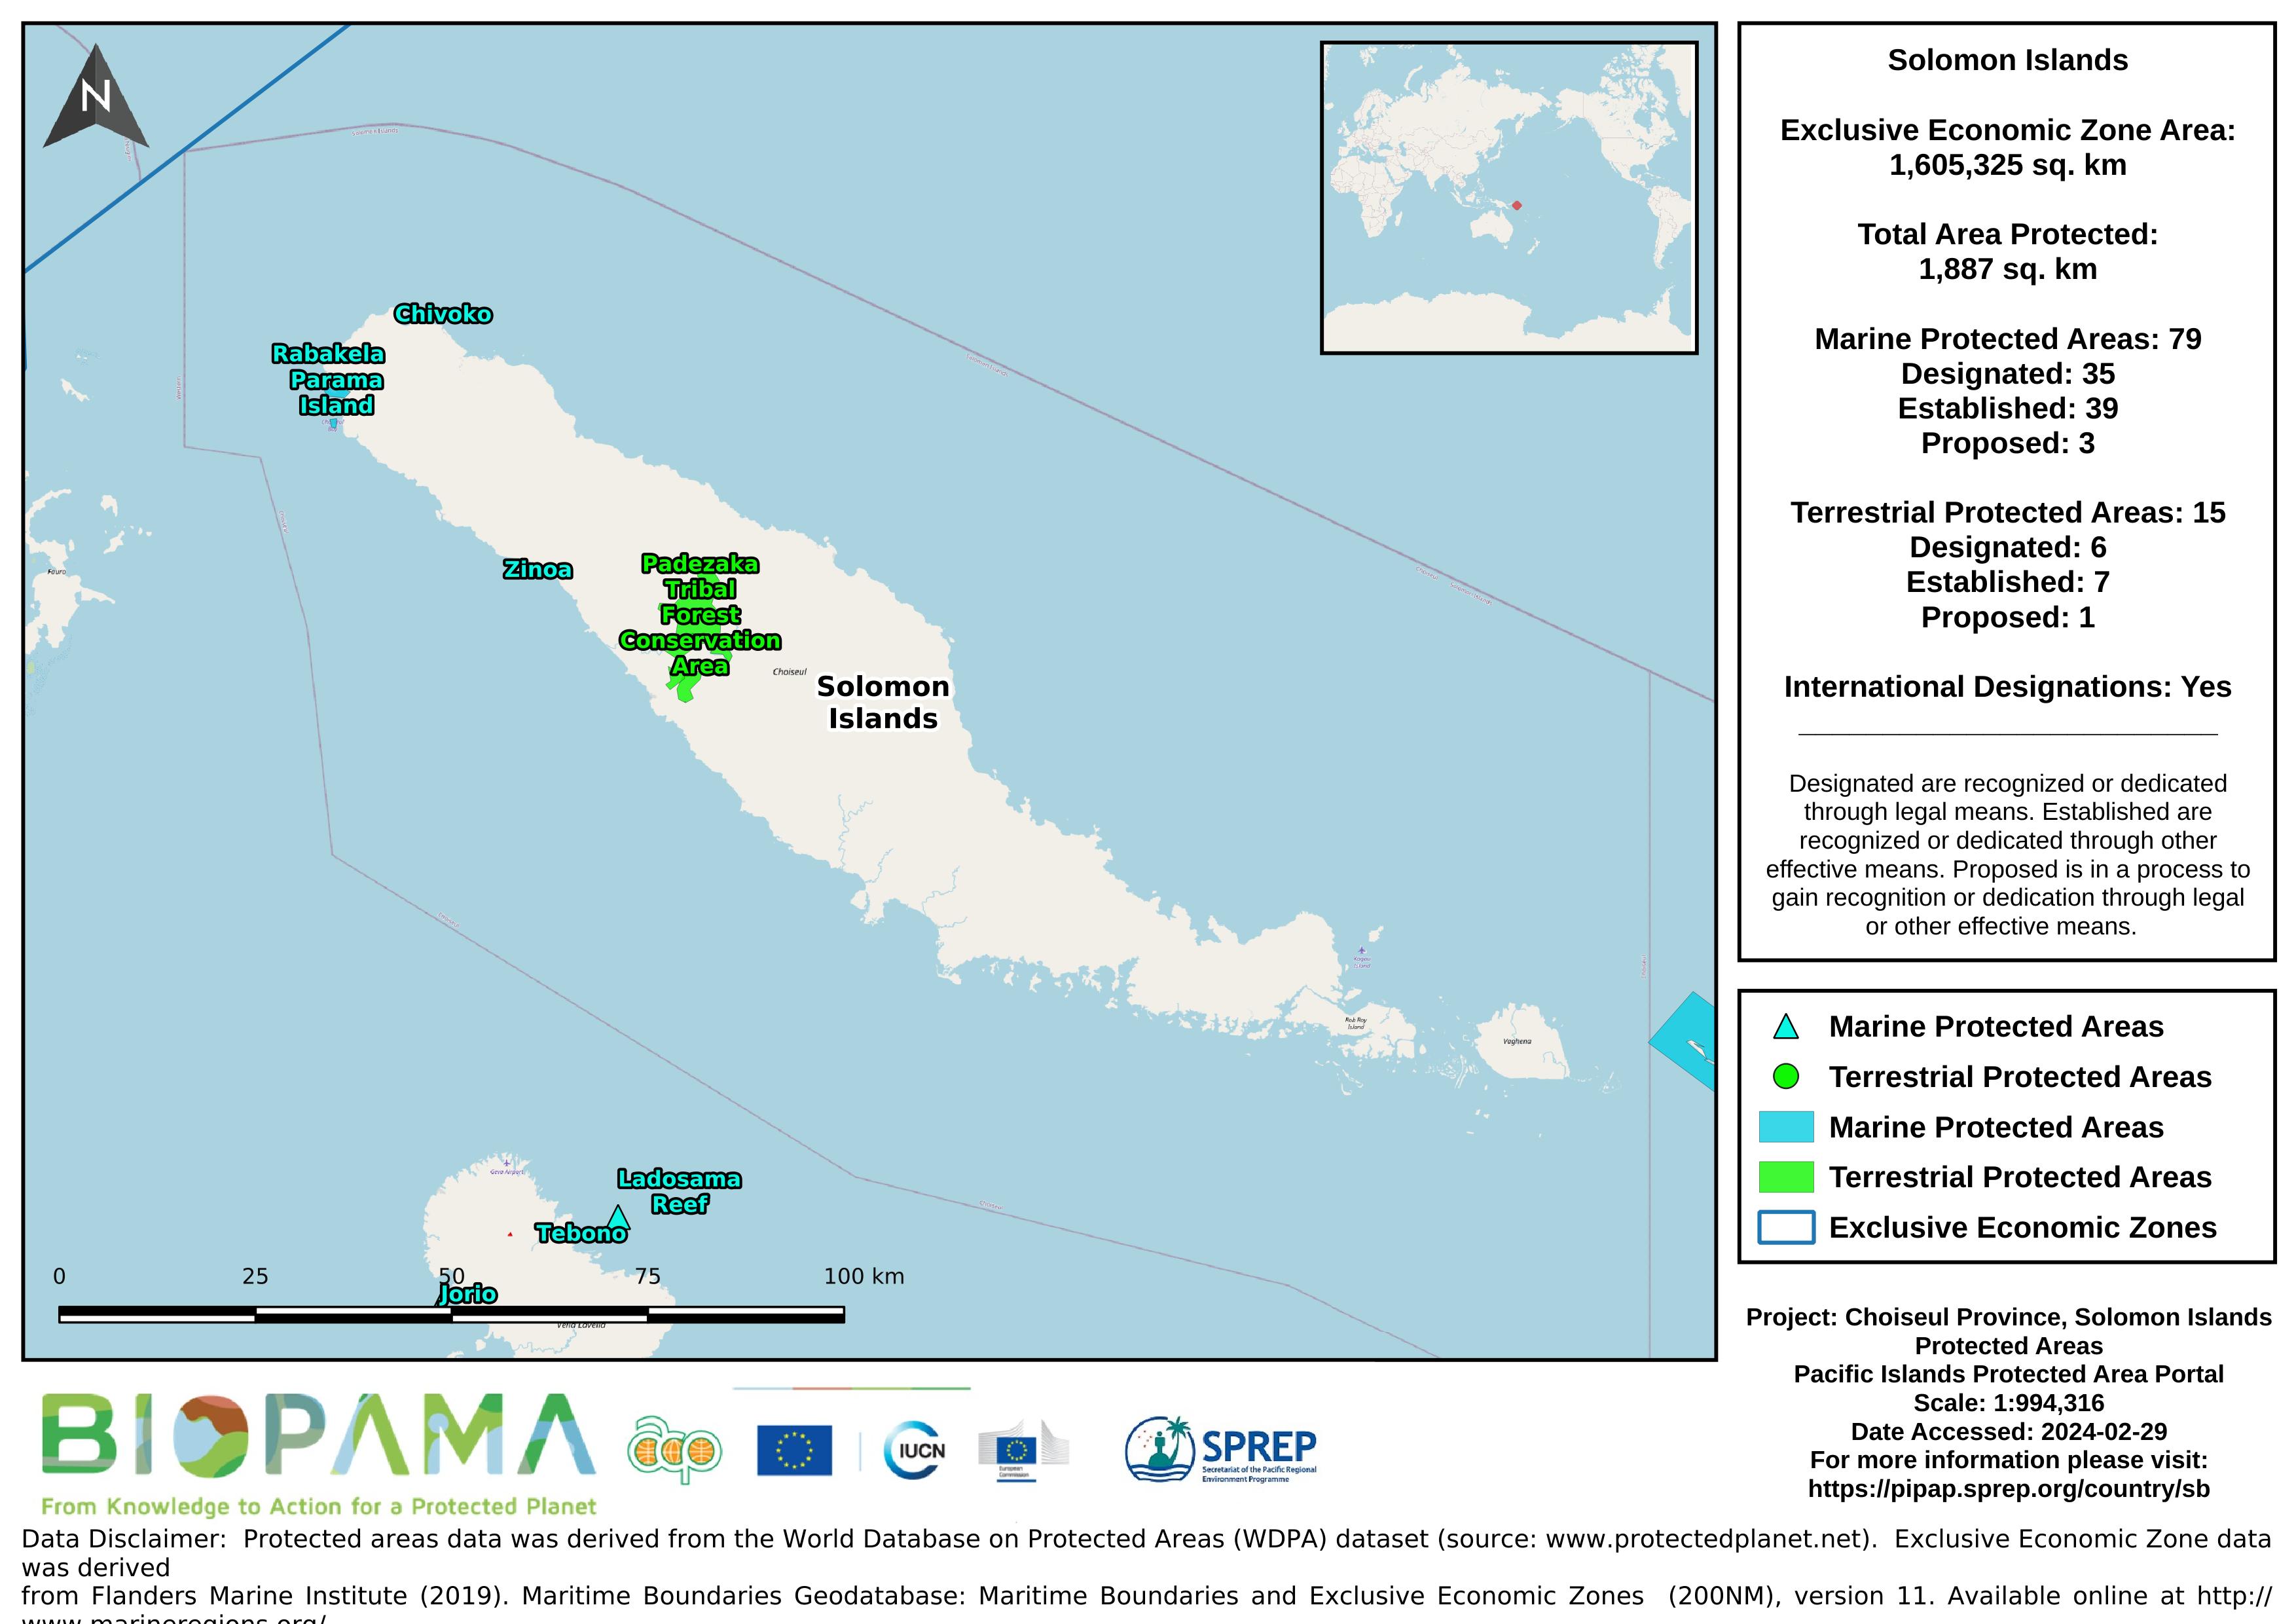
Map of the protected areas for Choiseul province in the Solomon Islands with country-level summary statistics on the amount of area under protection, count for each type of protected area (terrestrial or marine), and the count of their designation.
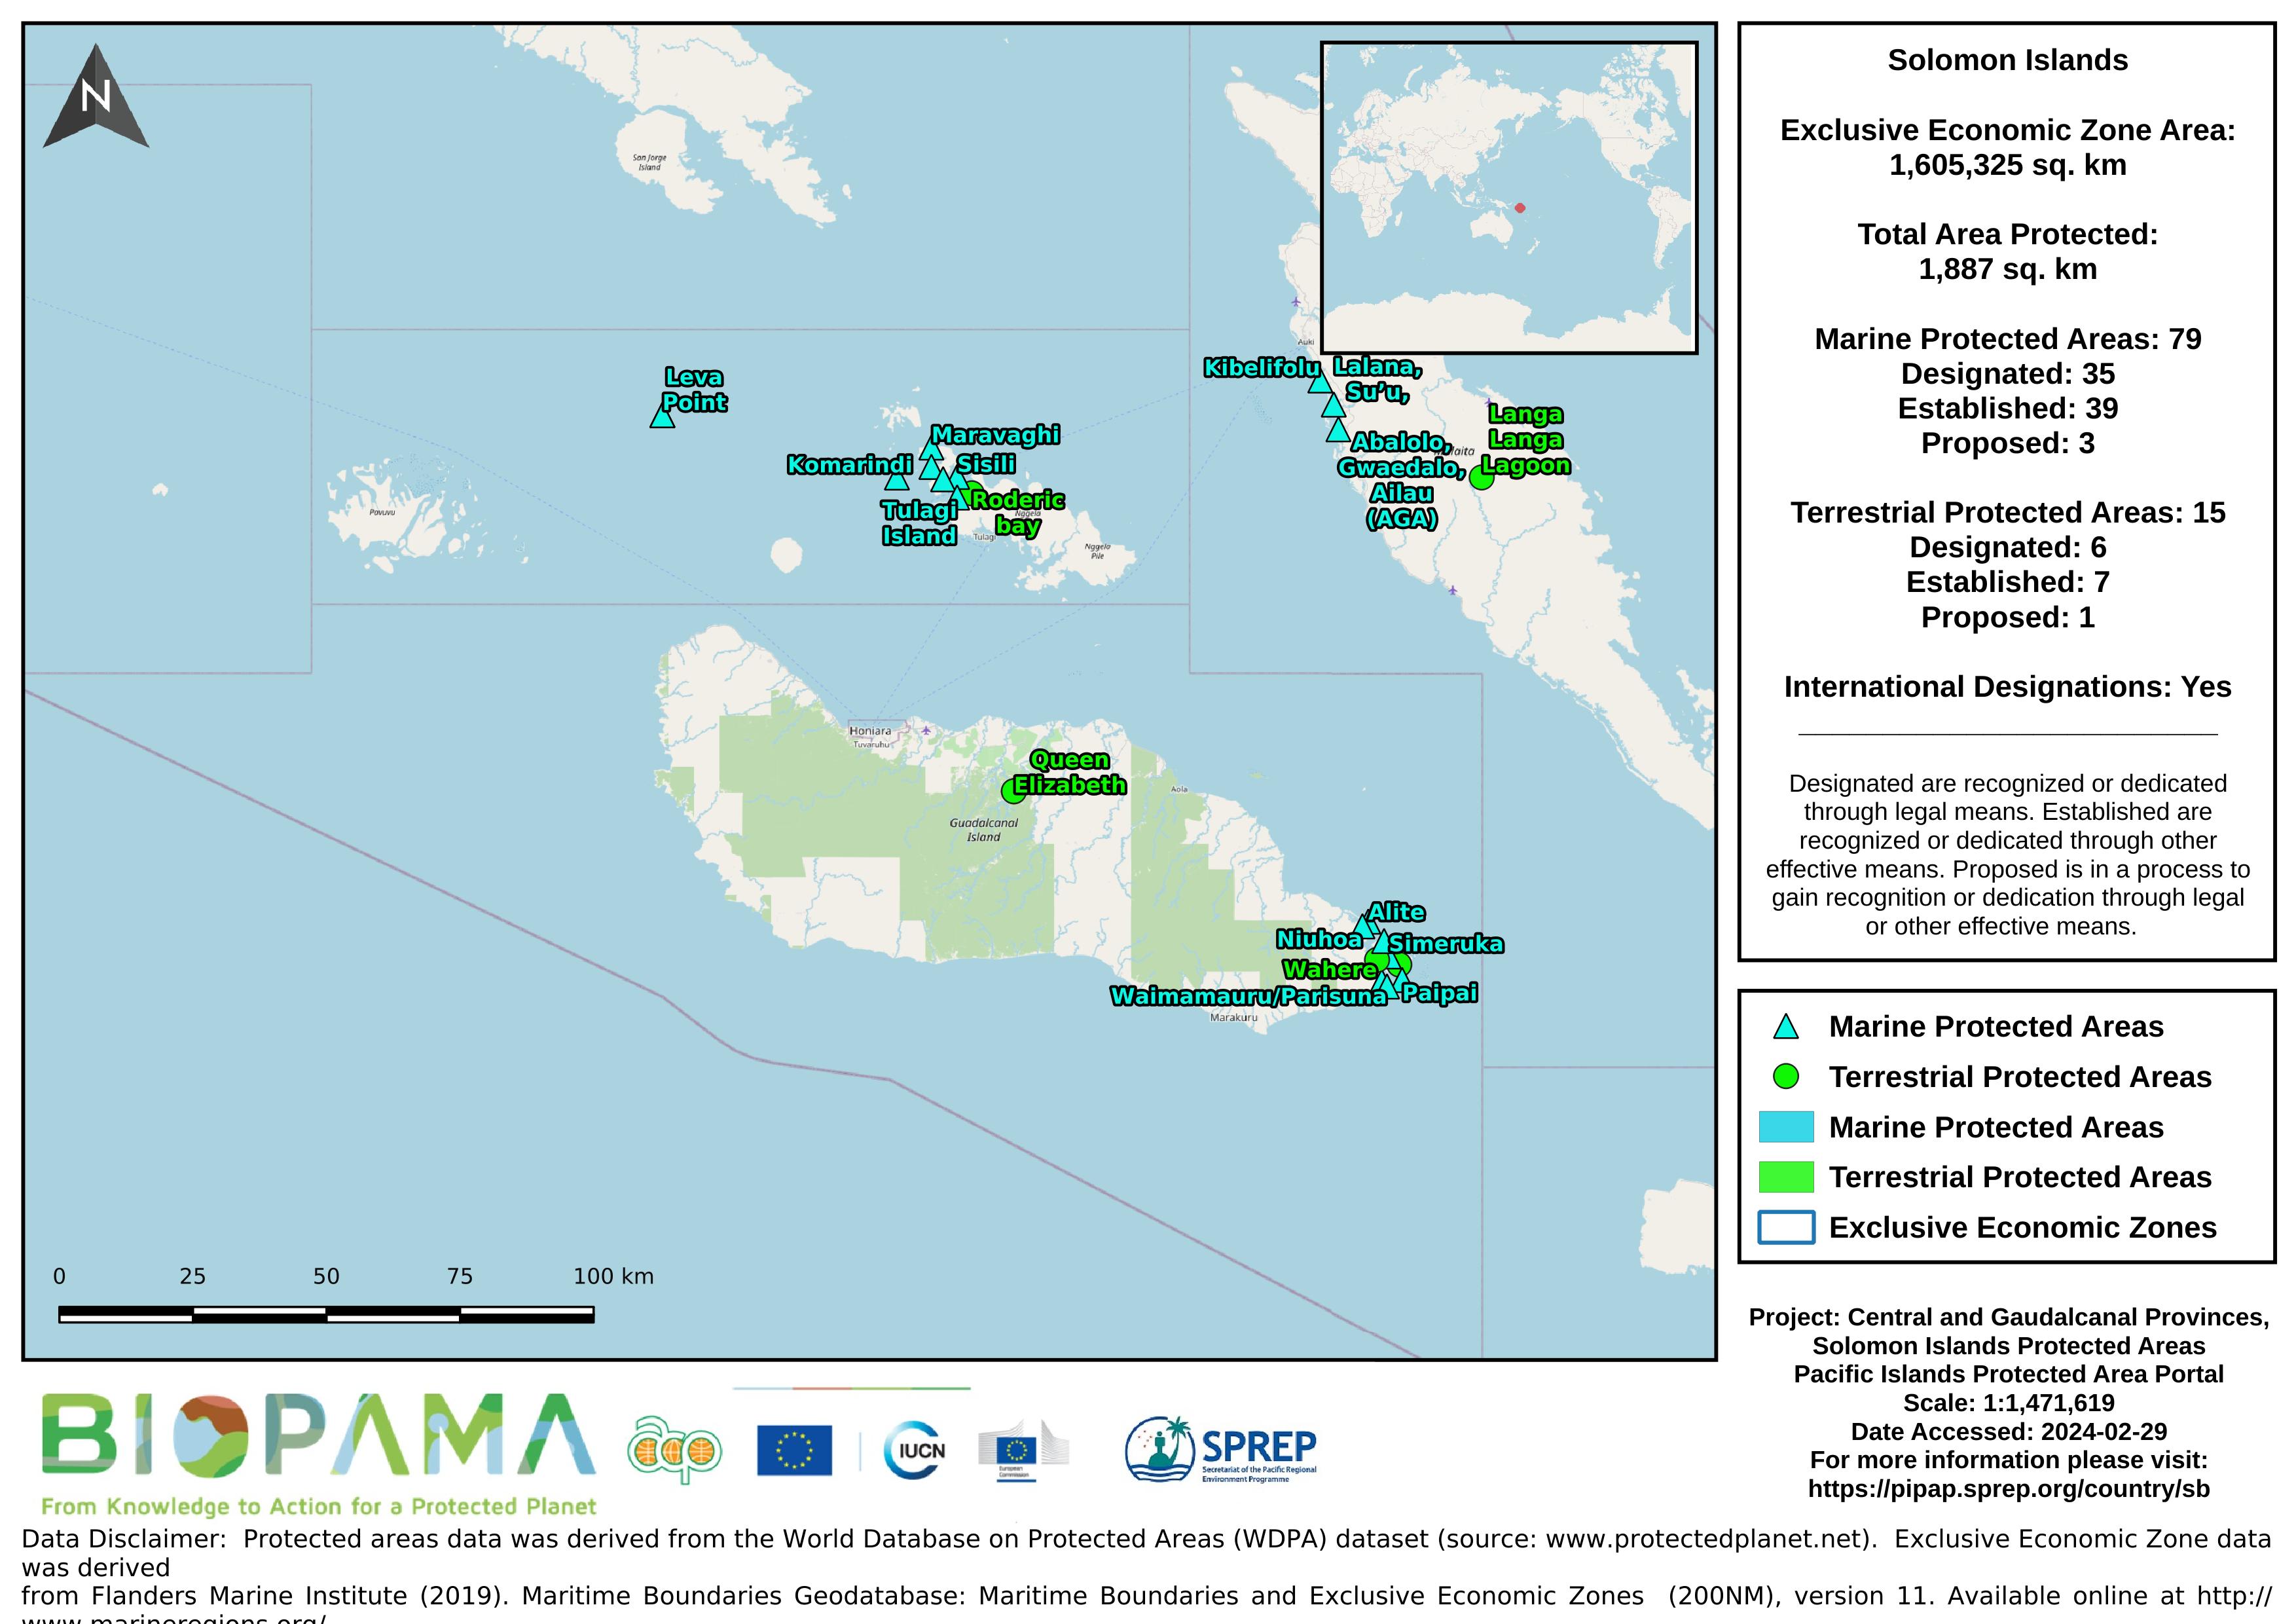
Map of the protected areas for Guadalcanal and Central provinces in the Solomon Islands with country-level summary statistics on the amount of area under protection, count for each type of protected area (terrestrial or marine), and the count of their designation.
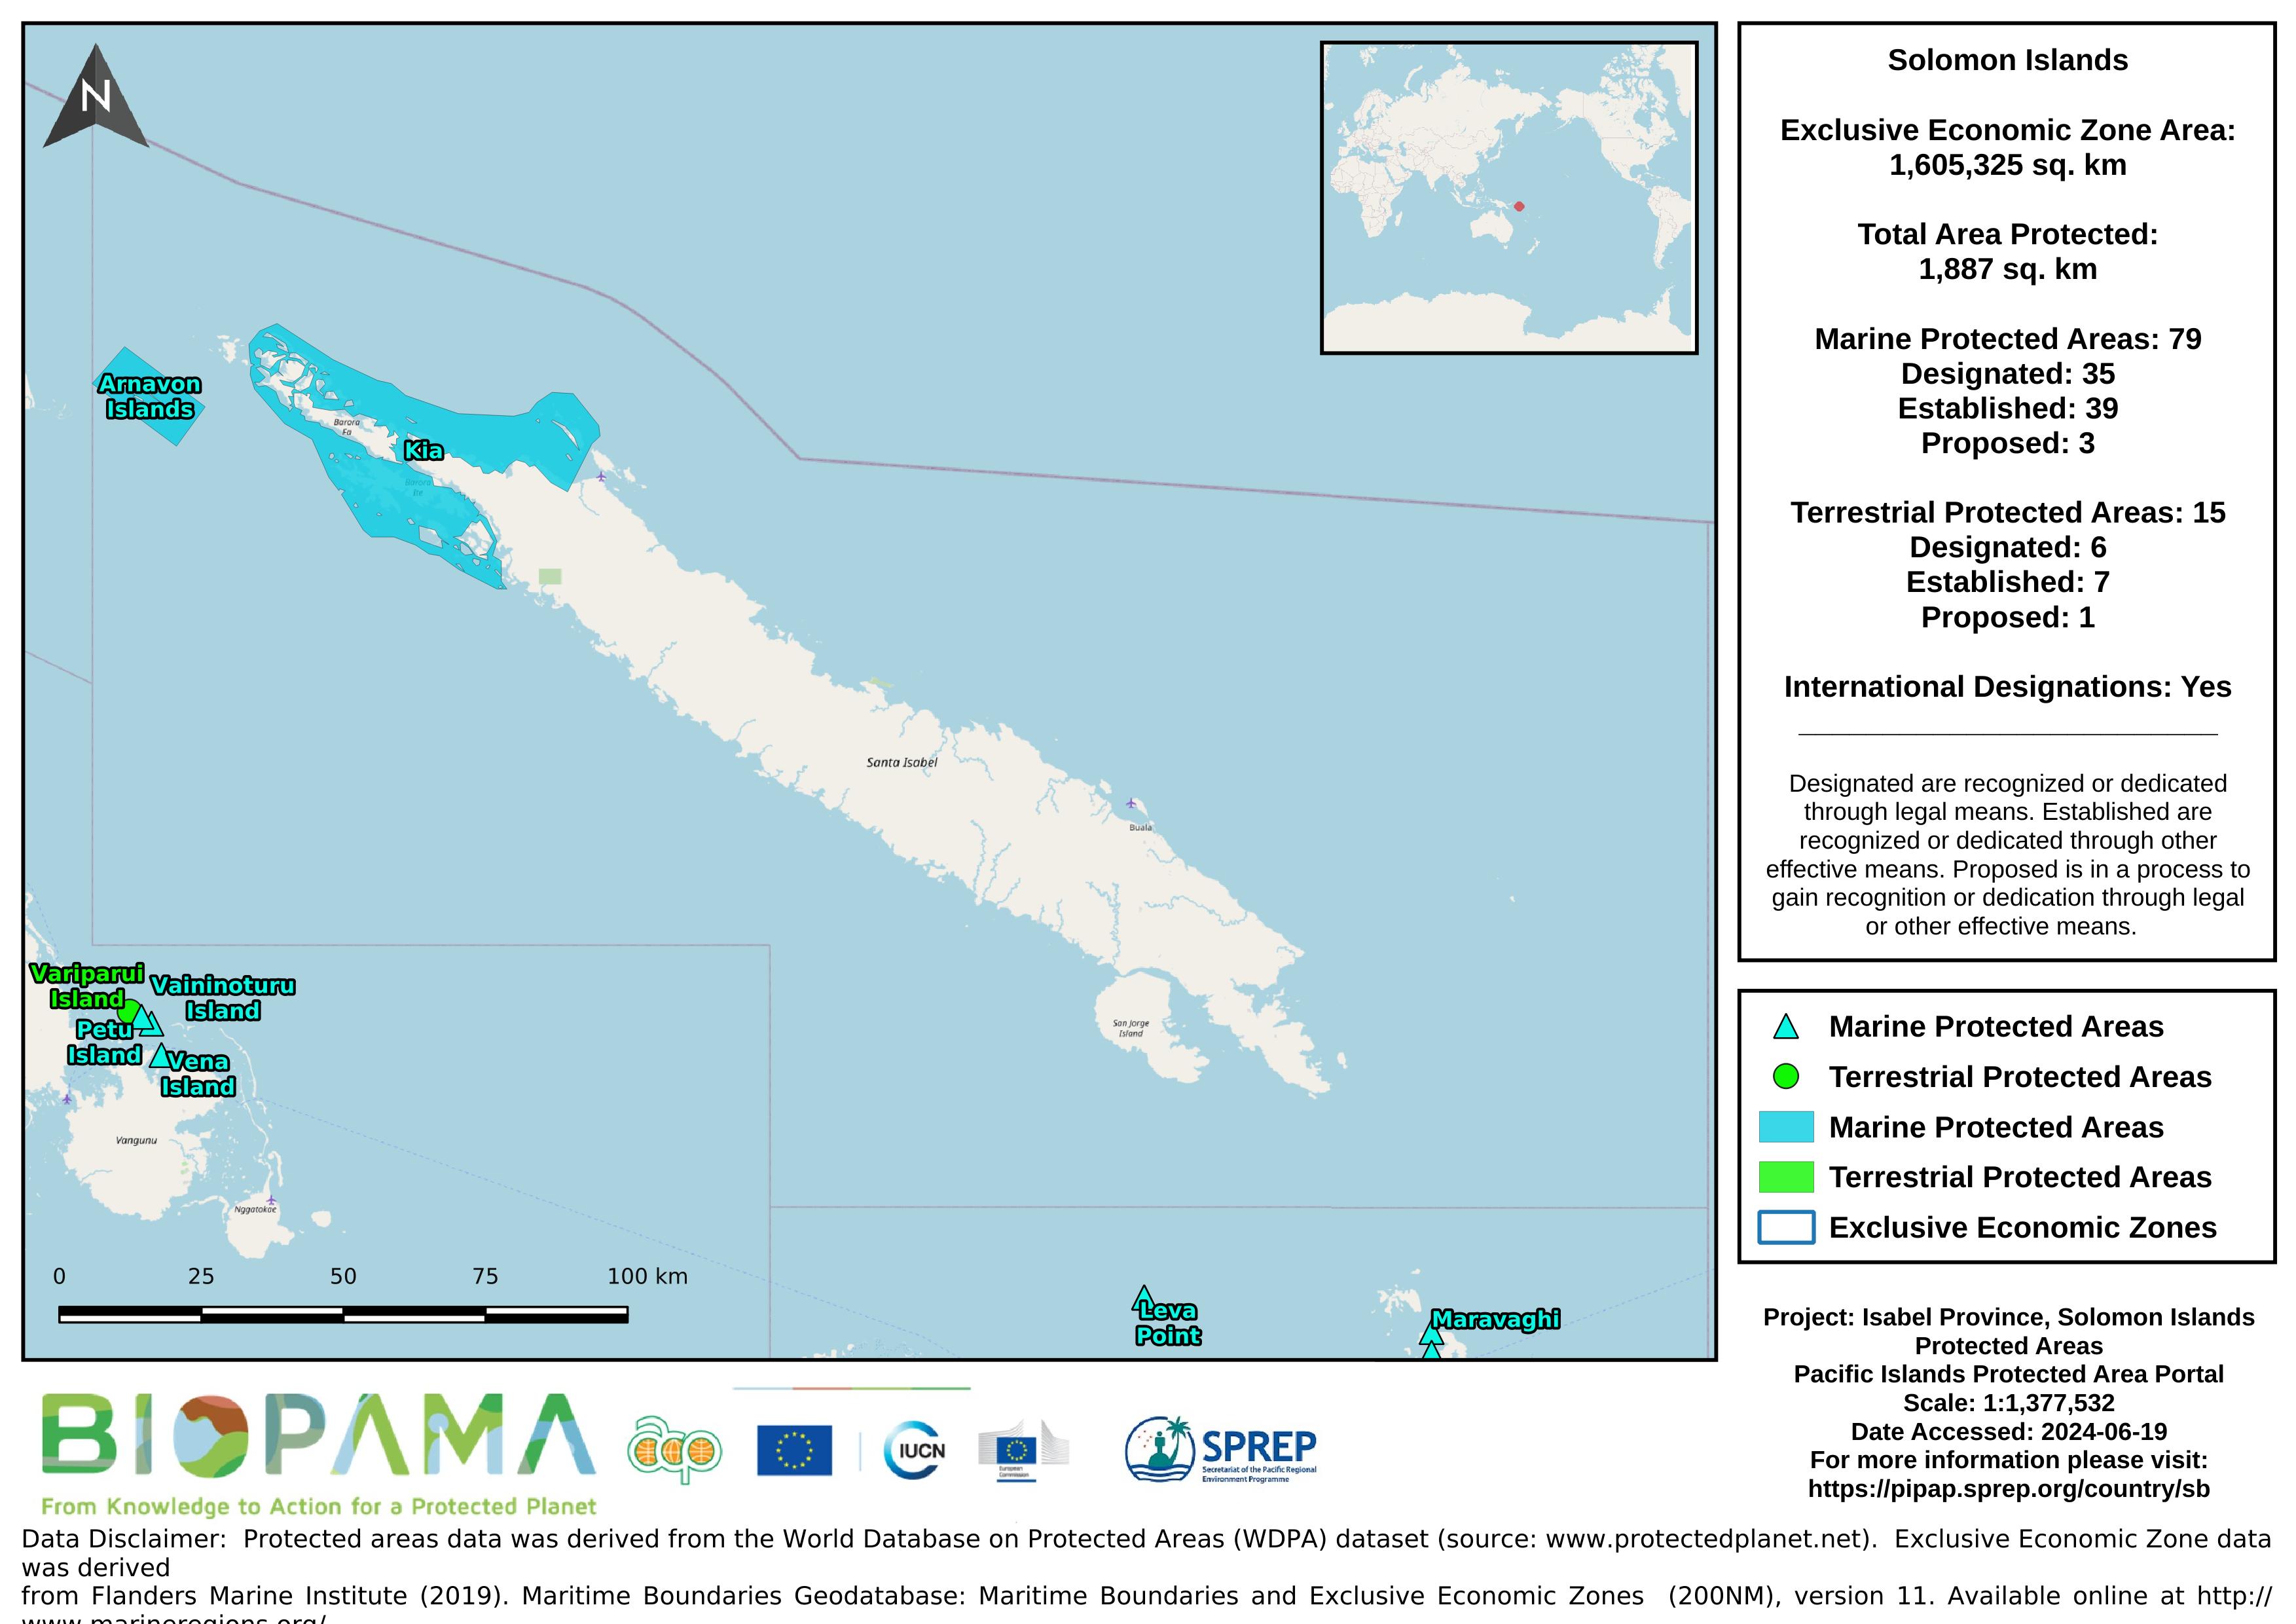
Map of the protected areas for Isabel province in the Solomon Islands with country-level summary statistics on the amount of area under protection, count for each type of protected area (terrestrial or marine), and the count of their designation.
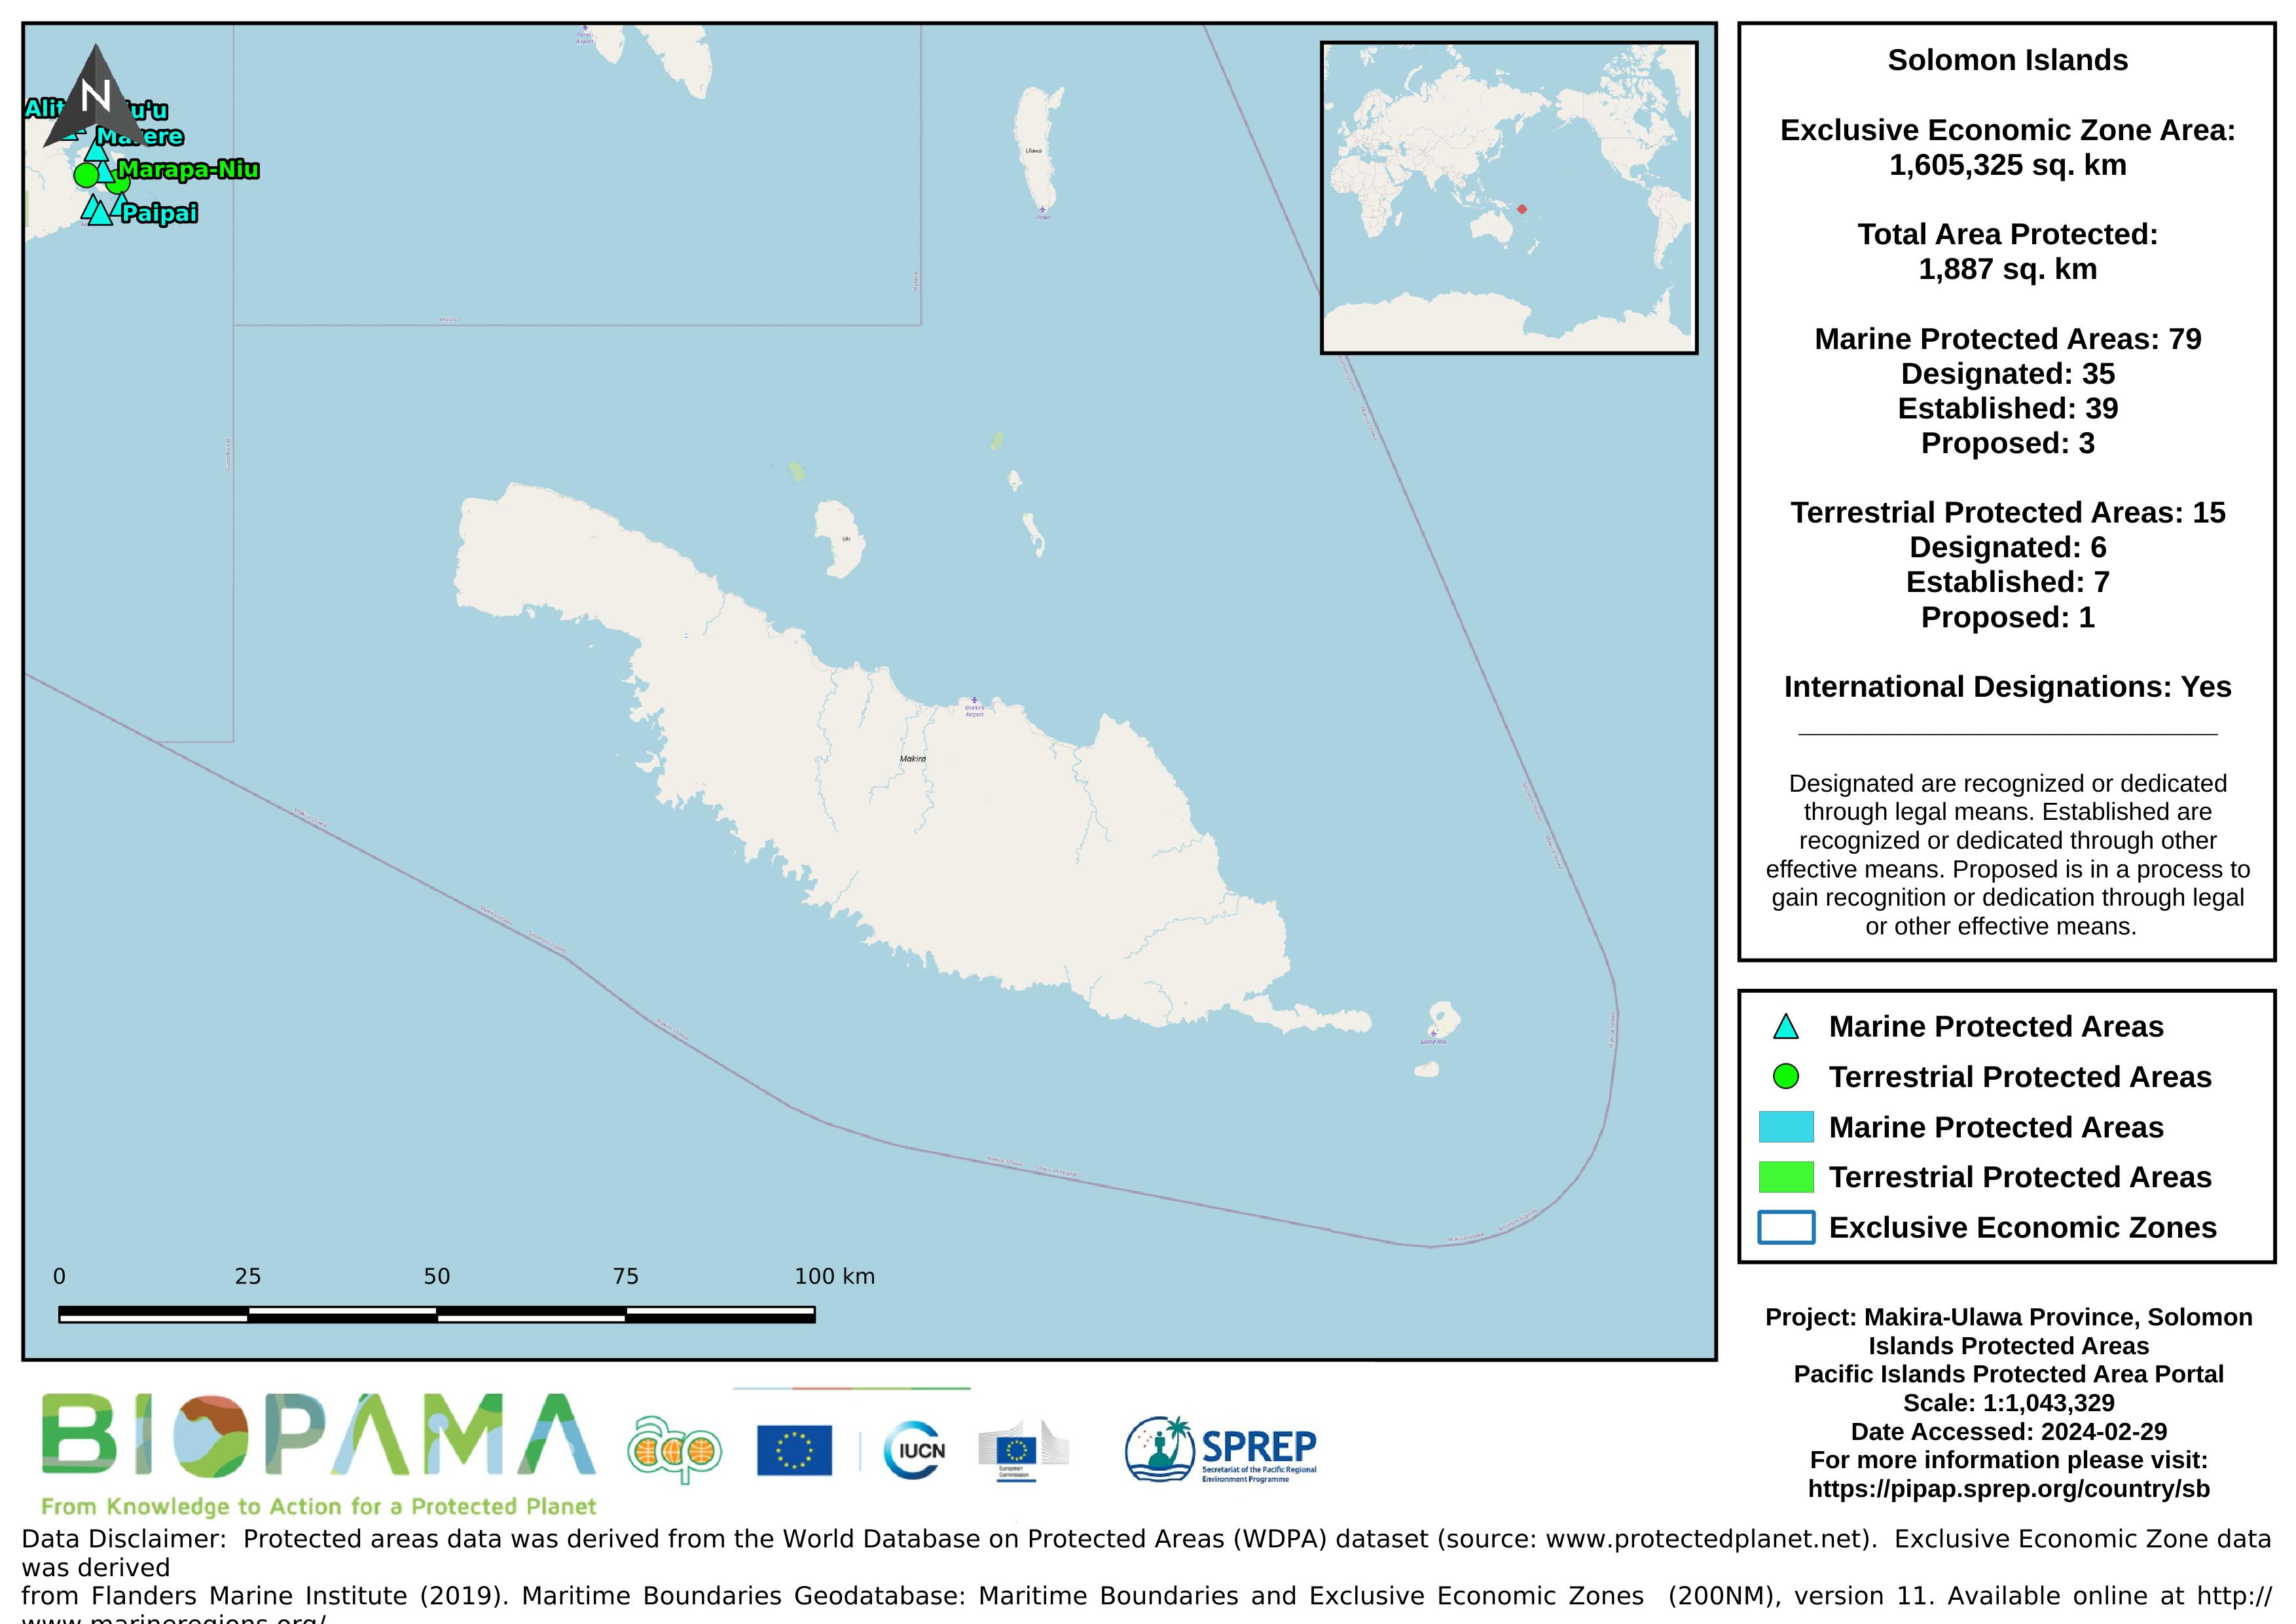
Map of the protected areas for Makira-Ulawa province in the Solomon Islands with country-level summary statistics on the amount of area under protection, count for each type of protected area (terrestrial or marine), and the count of their designation.
Map of predictions of relative probabilities of species occurence in a global grid of half-degree latitude and longitude cell dimensions.
Map of predictions of relative probabilities of benthic marine species occurence in a global grid of half-degree latitude and longitude cell dimensions.
Map of predictions of relative probabilities of pelagic species occurence in a global grid of half-degree latitude and longitude cell dimensions.
Map of artisanal fishing intensity based on data from the global map of human impacts (2008) (https://www.nceas.ucsb.edu/globalmarine2008/impacts).
Map developed by MACBIO for the bioregions workshop 2018. Chlorophyl-a concentration is an important proxy which is routinely measured and is considered a "core" parameter of global physical-biological oceanic models. Map is based on data from NASA's Aqua satellite.
The map contains the global distribution of habitat suitability for seven suborders of cold water octocoral found deeper than 50m. Map is based on data from Yesson et al (2012) Global habitat suitability of cold water Octocorals, Journal of Biogeography 39, 1278-1292.
The map displays the number of coral species that are expected to be found in each grid cell that contains coral reefs as identified by the Millenium Reefs project. The map is based on a spatial data base of geographic range boundaries compiled by the Australian Research Council Centre of Excellence for Coral Reef Studies compi
This map was developed by MACBIO as resource for the bioregions workshop 2017 and shows ocean surface currents based on data from NOAA Ocean Surface Current Analysis (http://www.oscar,noaa.gov/).
The map depicts paths and intensities of tropical cyclones in Solomon Islands EEZ from 1980 till 2015. Data of tropical cyclone best track data is provided by IBTrACS (International Best Track Archive for Climate Stewardship).
The map shows the diffuse attenuation coefficient (Kd490) which is an indicator of the turbidity of the water column. The grid is derived from MODIS (Moderate Resolution Imaging Spectoradiometer) images from NASA's Terra and Aqua satellites (http://oceancolor.gsfc.nasa.gov).
The map shows the domestic shipping routes in Solomon Islands EEZ. Data is based on information from Harbour Master of Ports Authority. The map was developed by MACBIO as resource for the bioregions workshop in Feb 2018.