The dolphin hunts in the Solomon Islands are typically conducted between January and April, when the seas are calm. Home to the largest drive slaughter of dolphins in the world, annual kills between the years 1976-2013 averaged 850 dolphins per year. Since Dolphin Project began a full-time campaign in 2015 in Fanalei, Solomon Islands, slaughters have dropped to a four-year average of 247 dolphins.
In most villages, affected families lost on average 1 canoe or less, but from the 40 households in Tapurai predisaster, it was estimated that more than 58 canoes were lost.
*data extracted from the pdf report*
Villagers explained that losses of fishing gear were related to the destruction of houses. Fishing gear (lines, goggles, spears etc.) was stored within houses and if a house was washed away by the wave then all gear was lost. An indication of the types of gear that were lost or damaged in the tsunami is given in this data, based on individual interviews with fisher.
*data extracted from pdf report*
he 33 deepwater bioregions for the Solomon Islands were condensed into 26 bioregions. The major changes were made to the northwestern side of the Solomon Islands EEZ; there was general agreement about the deepwater bioregions in the southeastern half of the country. Bioregions 120, 164, 167, 192, 244, and 304 were merged with Bioregion 222. Bioregion 226 was split into two halves, and one part of the non-contiguous Bioregion 240 (the part closer to the islands) was merged with 222.
reef-associated bioregions for the Solomon Islands
The bolded ecosystem services in this table are likely to be less resilient to future climate conditions
*please refer to Honiara Ecosystem Based Adaptation assessment and masterplan report for narration and further information*
Prioritized EbA adaptation options
*please refer to Honiara Ecosystem Adaptation Assessment report for narration and further information*
Indication of location for the establishment of the Barana and Queen Elizabeth Park to improve the upper Mataniko and Lungga catchment area’s provision of fresh water supply and other ecosystem services.
*refer to Honiara Ecosystem Based Adaptation Option Assessment report for more detailed information*
This dataset contains economic information for catch and catch vessels in the Asia and Pacific region, including country-level data on Solomon Islands.
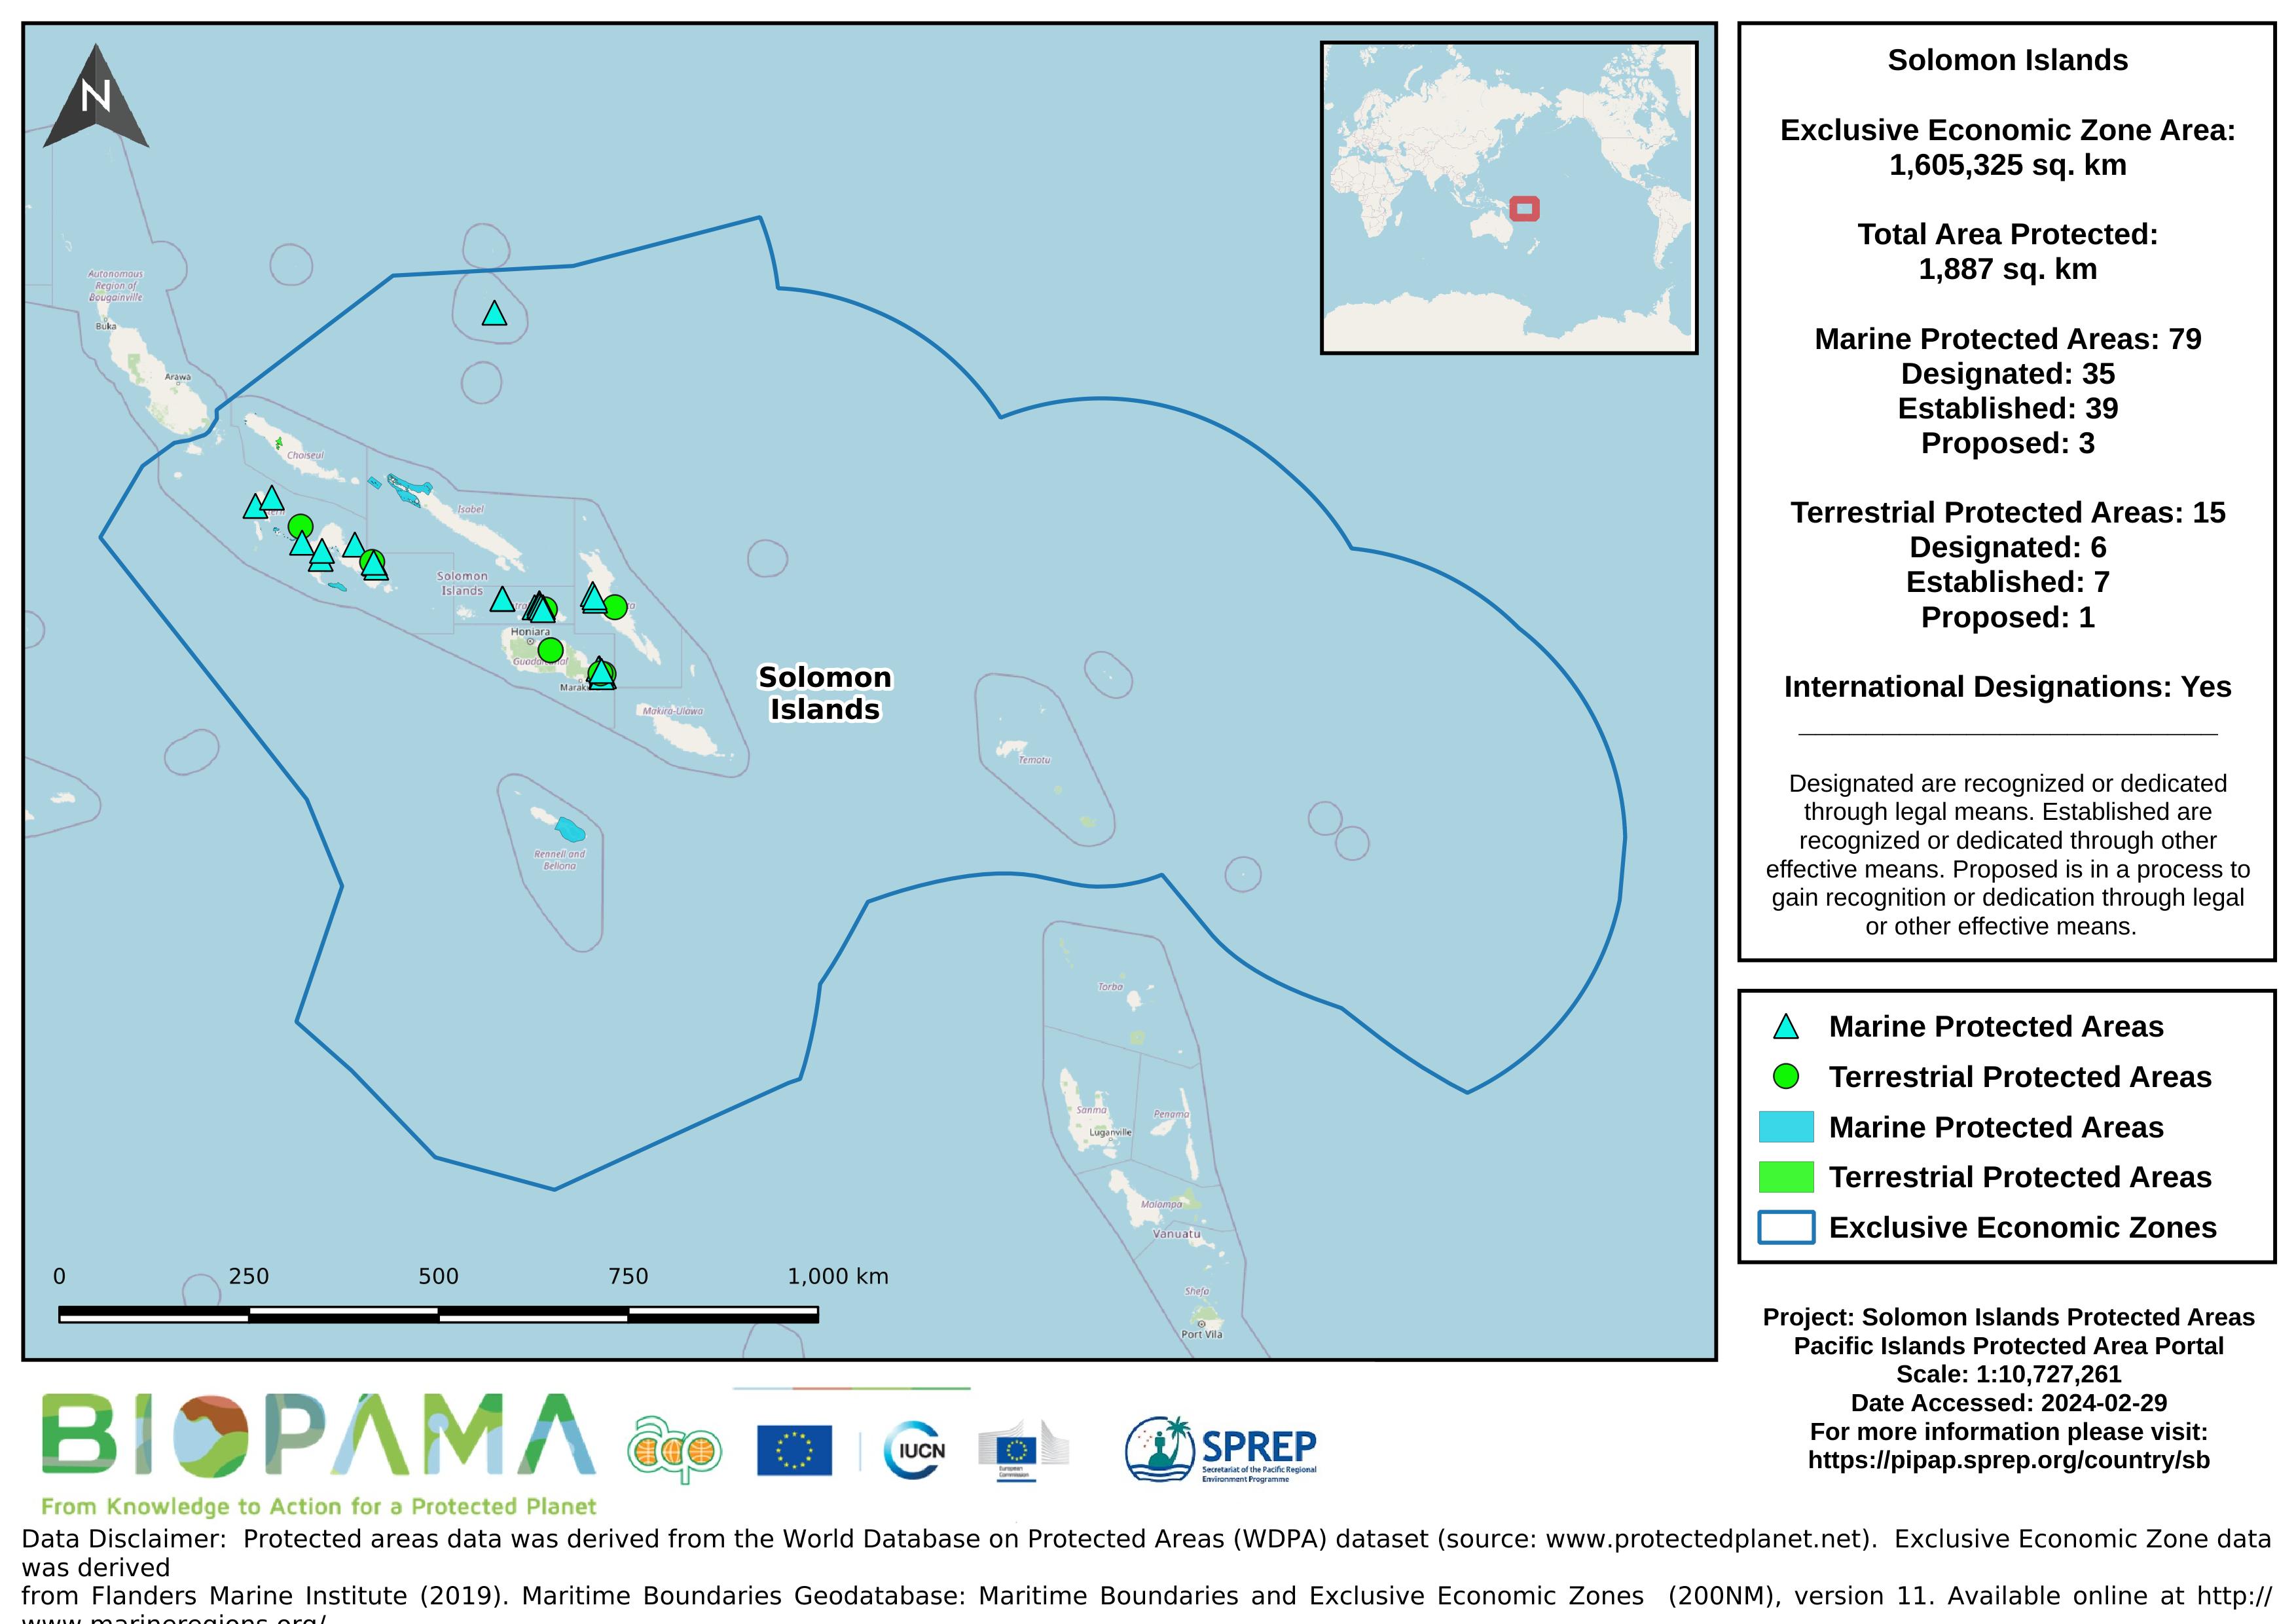
Map of the protected areas for the Solomon Islands with country-level summary statistics on the amount of area under protection, count for each type of protected area (terrestrial or marine), and the count of their designation.
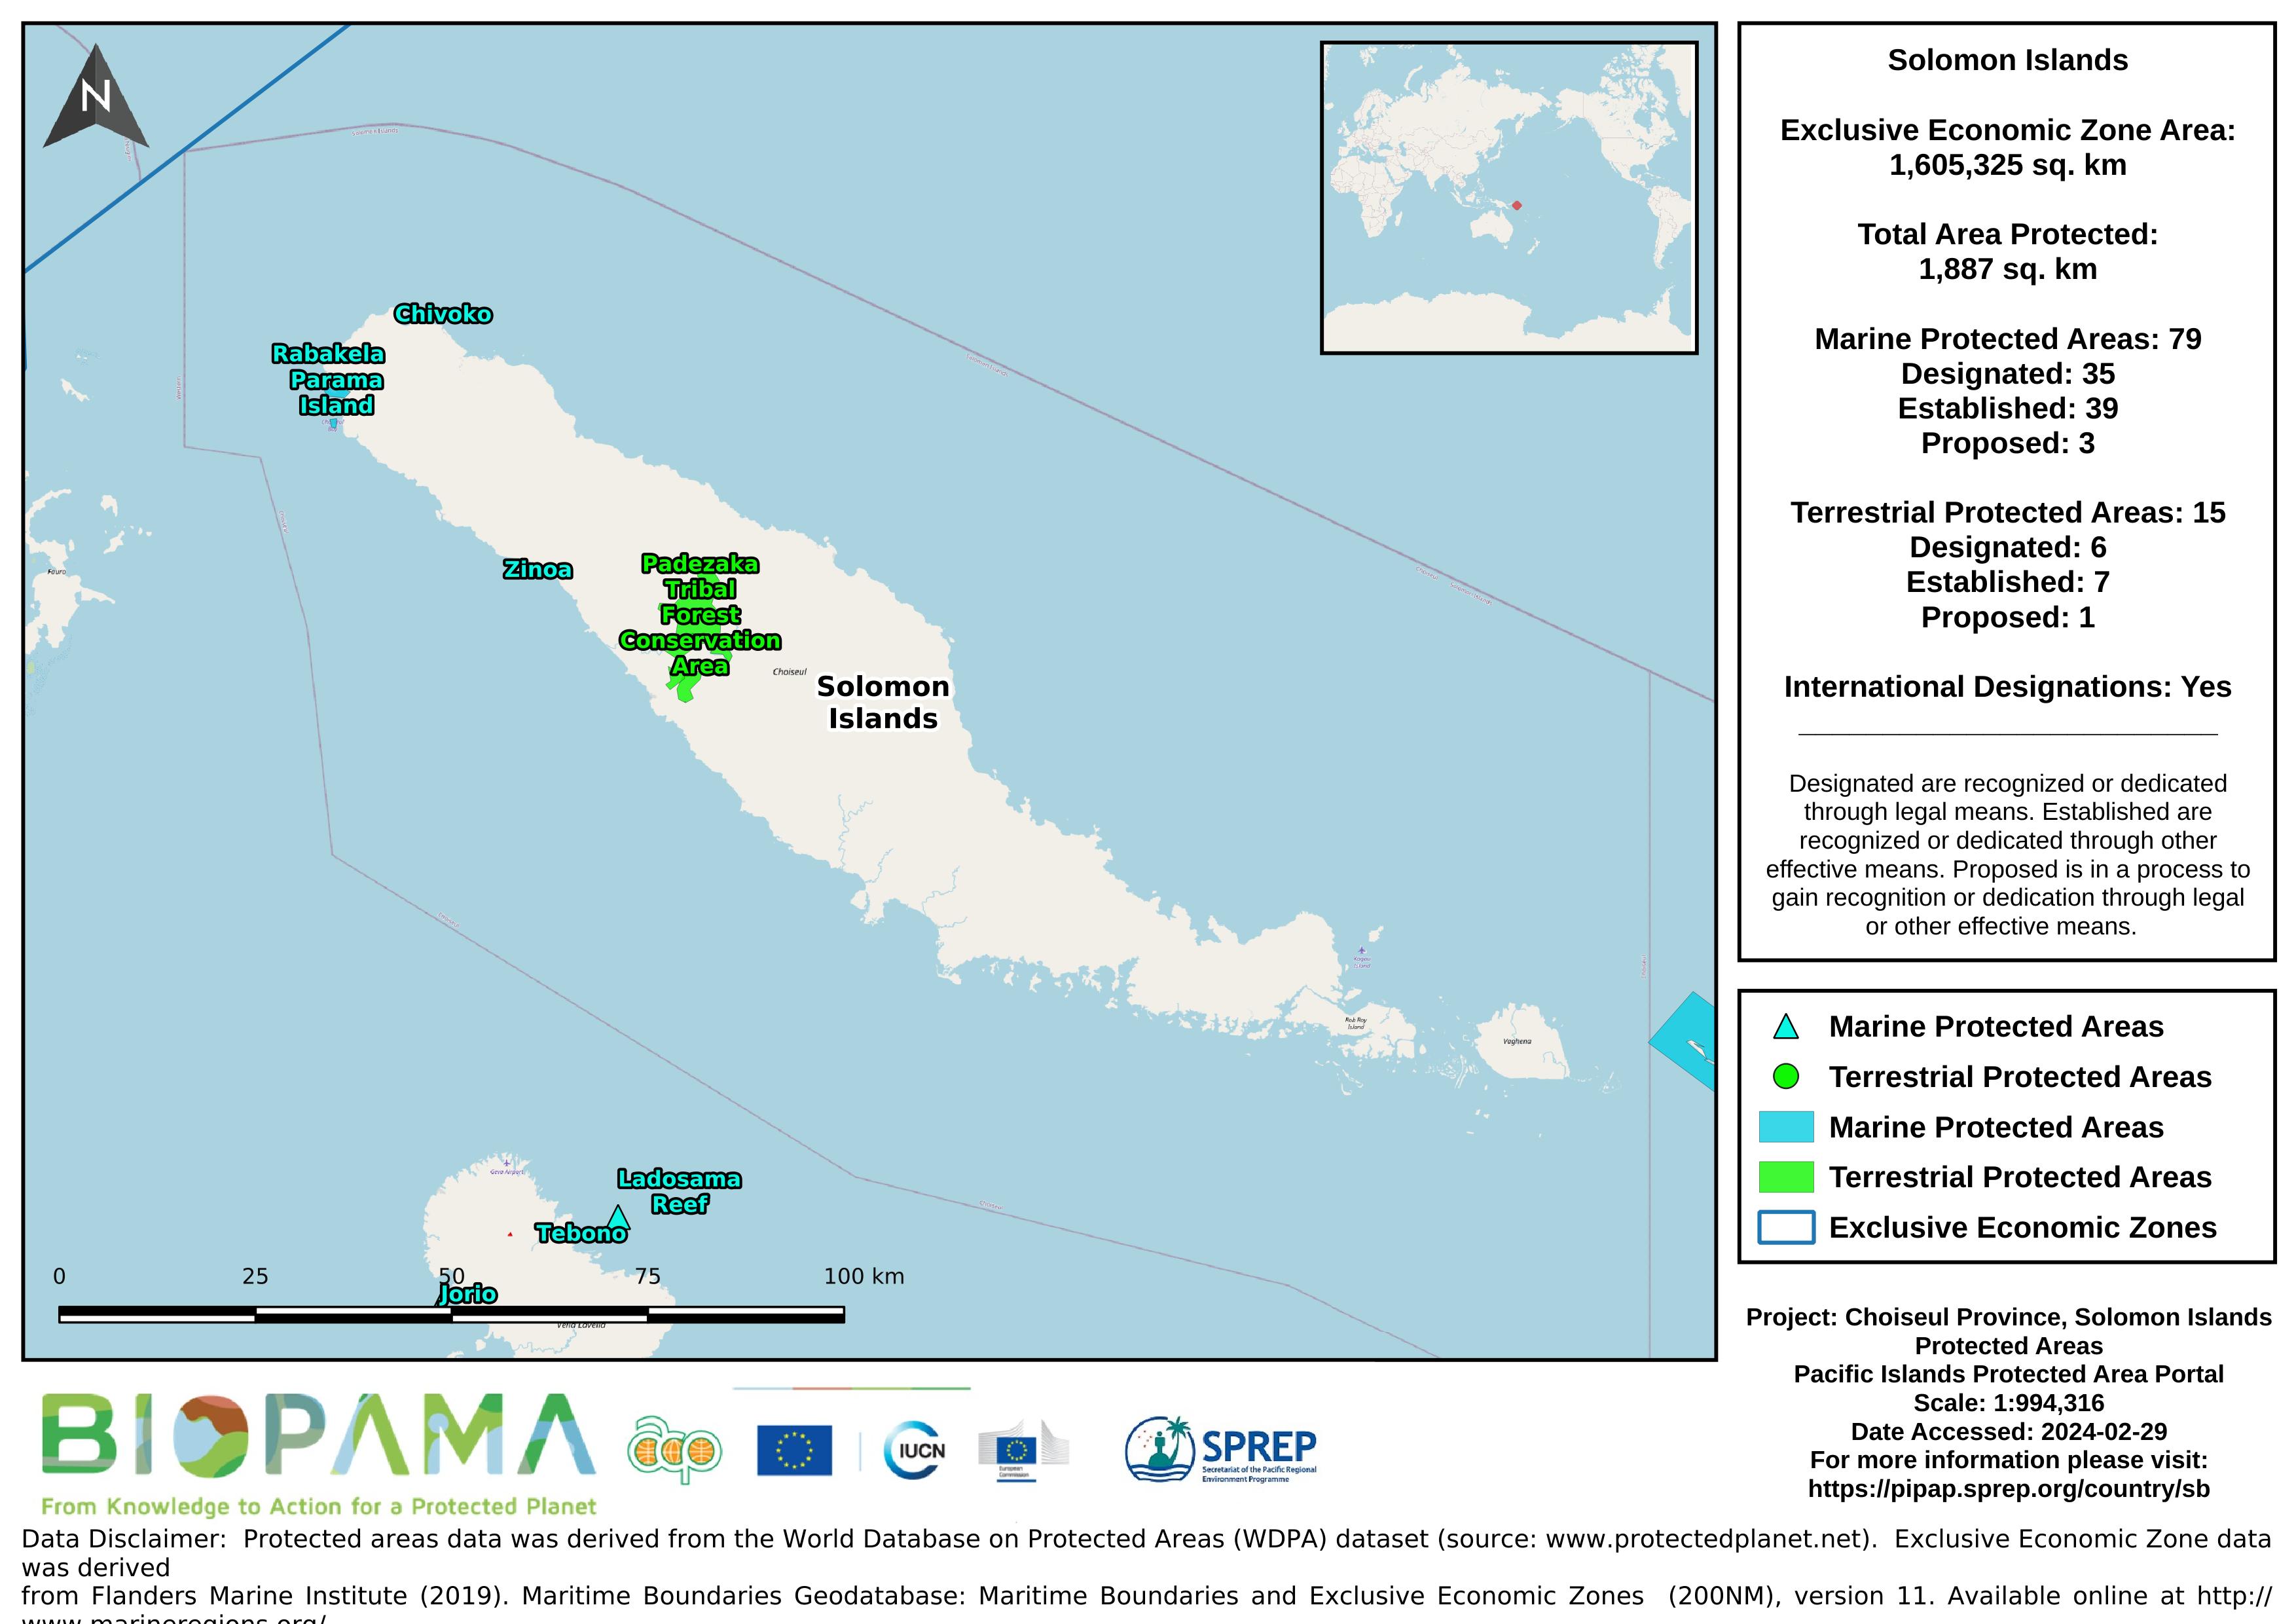
Map of the protected areas for Choiseul province in the Solomon Islands with country-level summary statistics on the amount of area under protection, count for each type of protected area (terrestrial or marine), and the count of their designation.
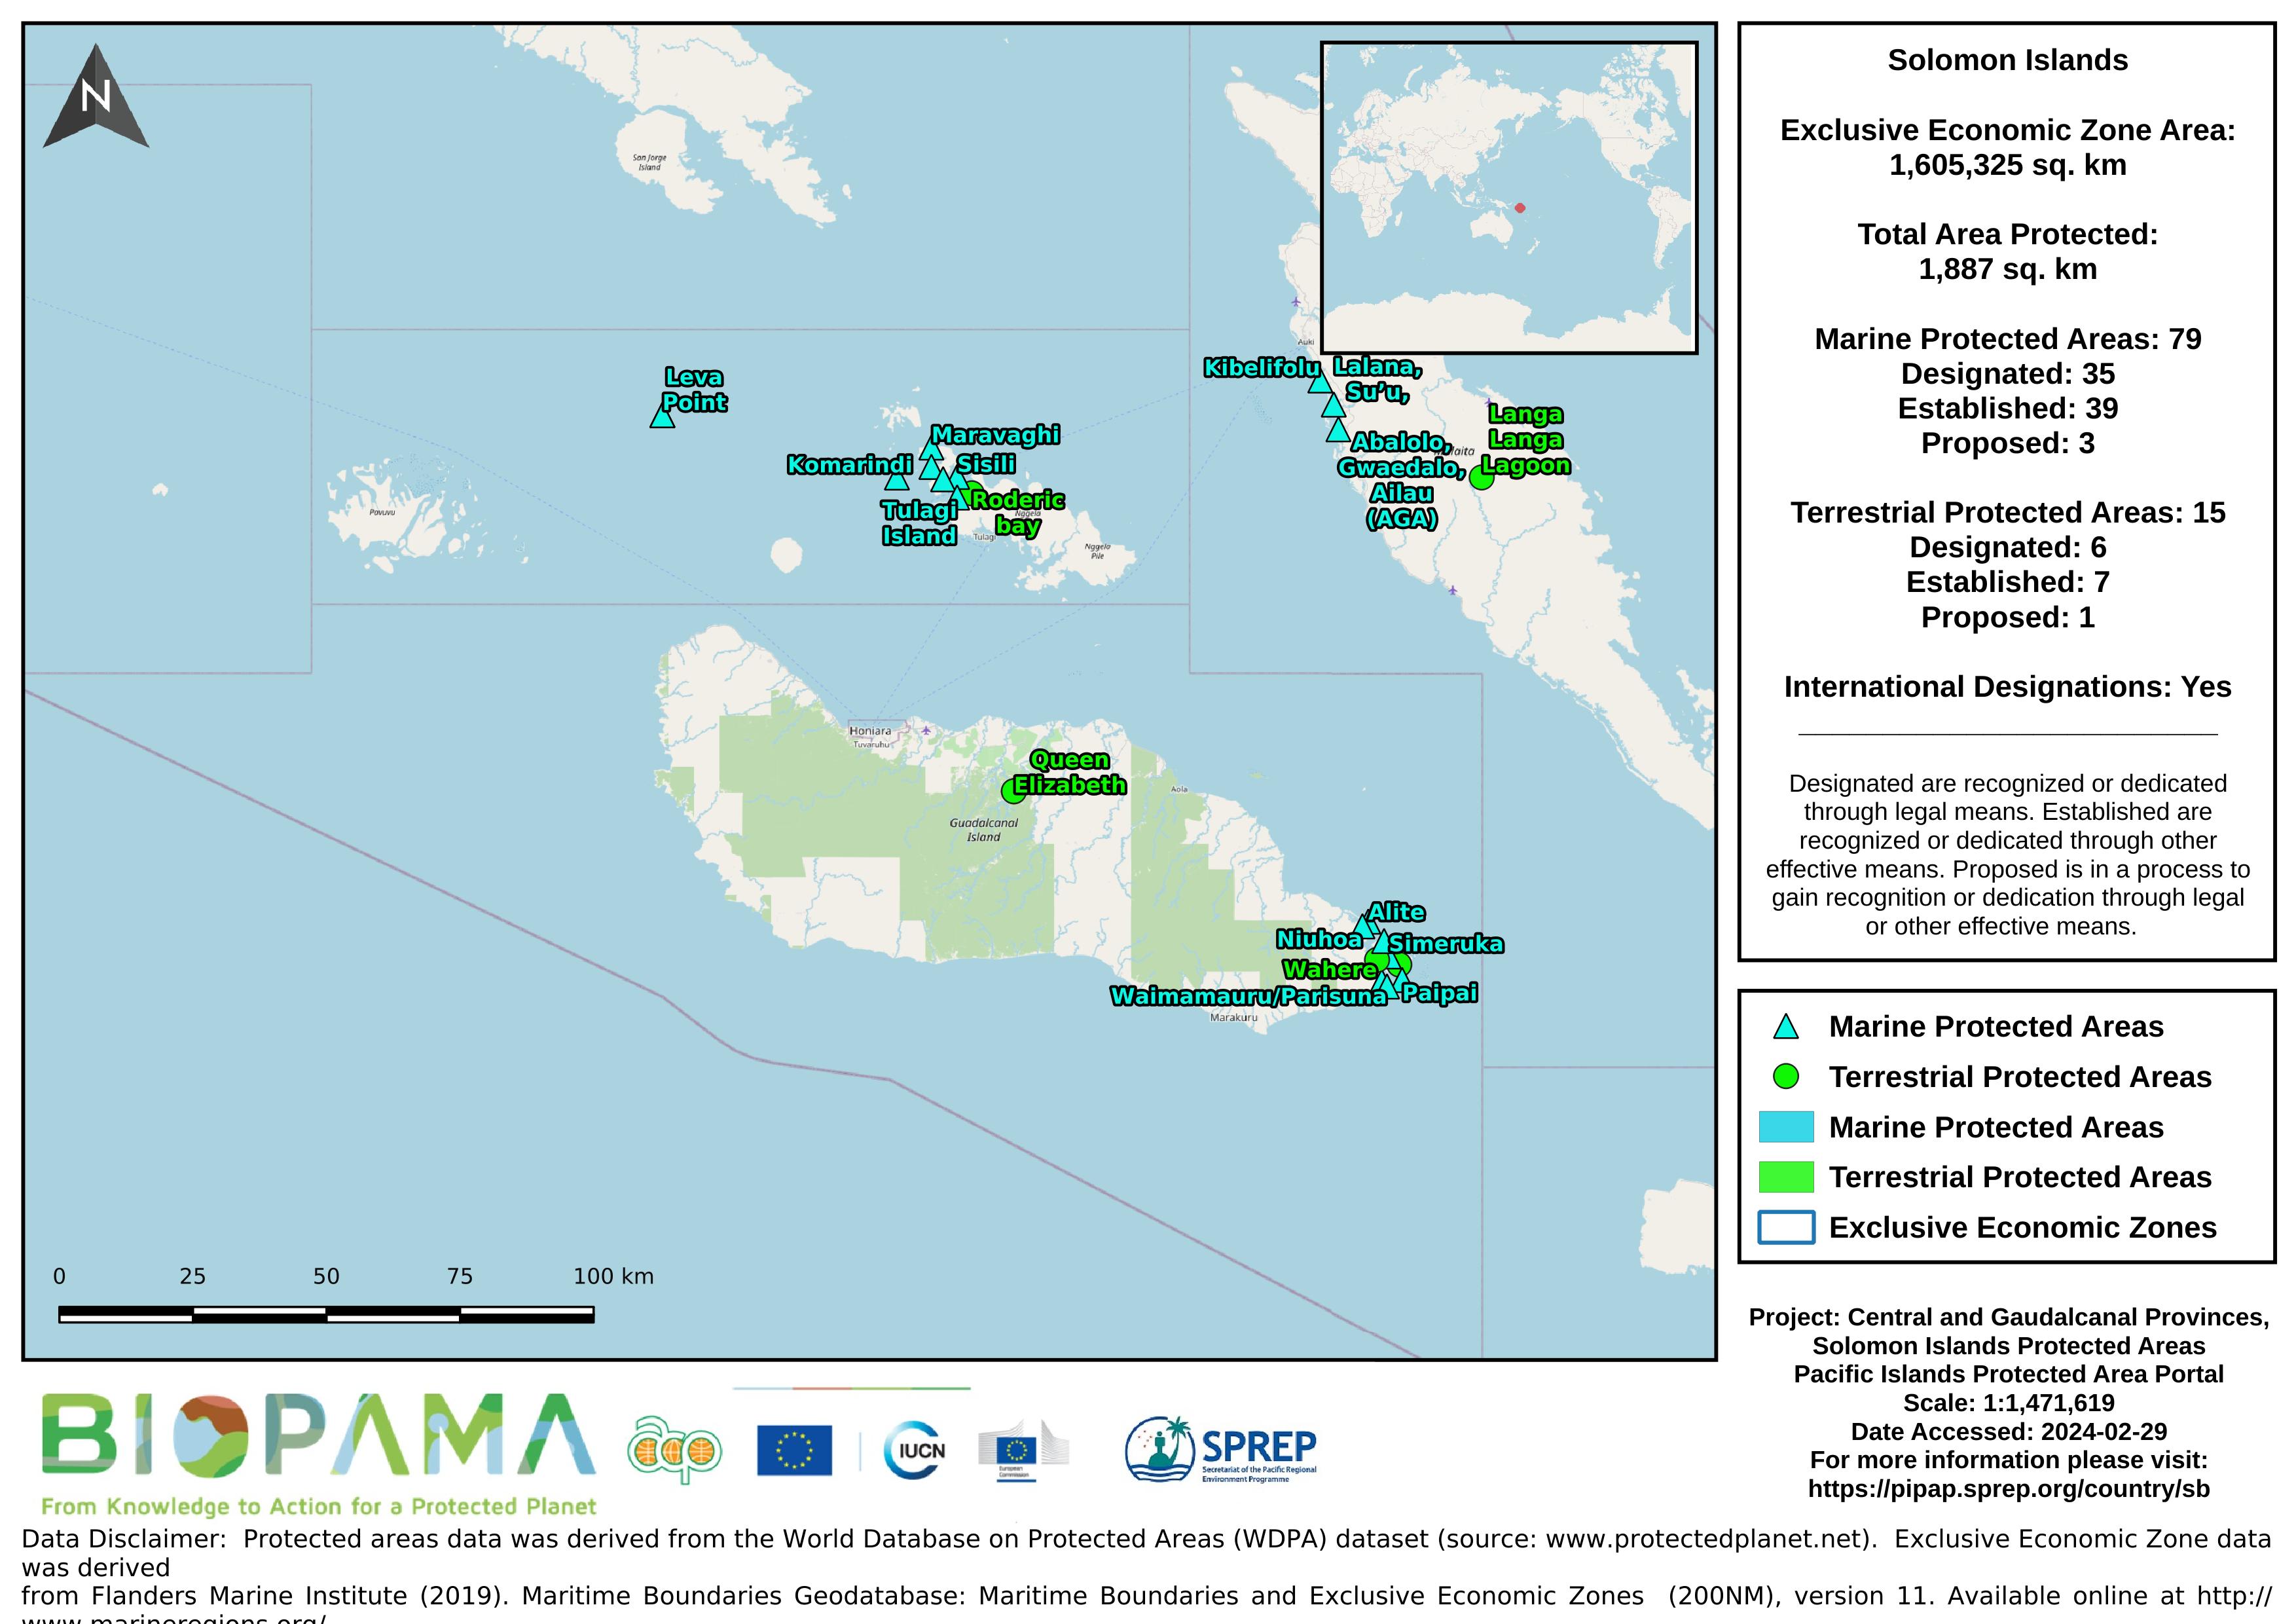
Map of the protected areas for Guadalcanal and Central provinces in the Solomon Islands with country-level summary statistics on the amount of area under protection, count for each type of protected area (terrestrial or marine), and the count of their designation.
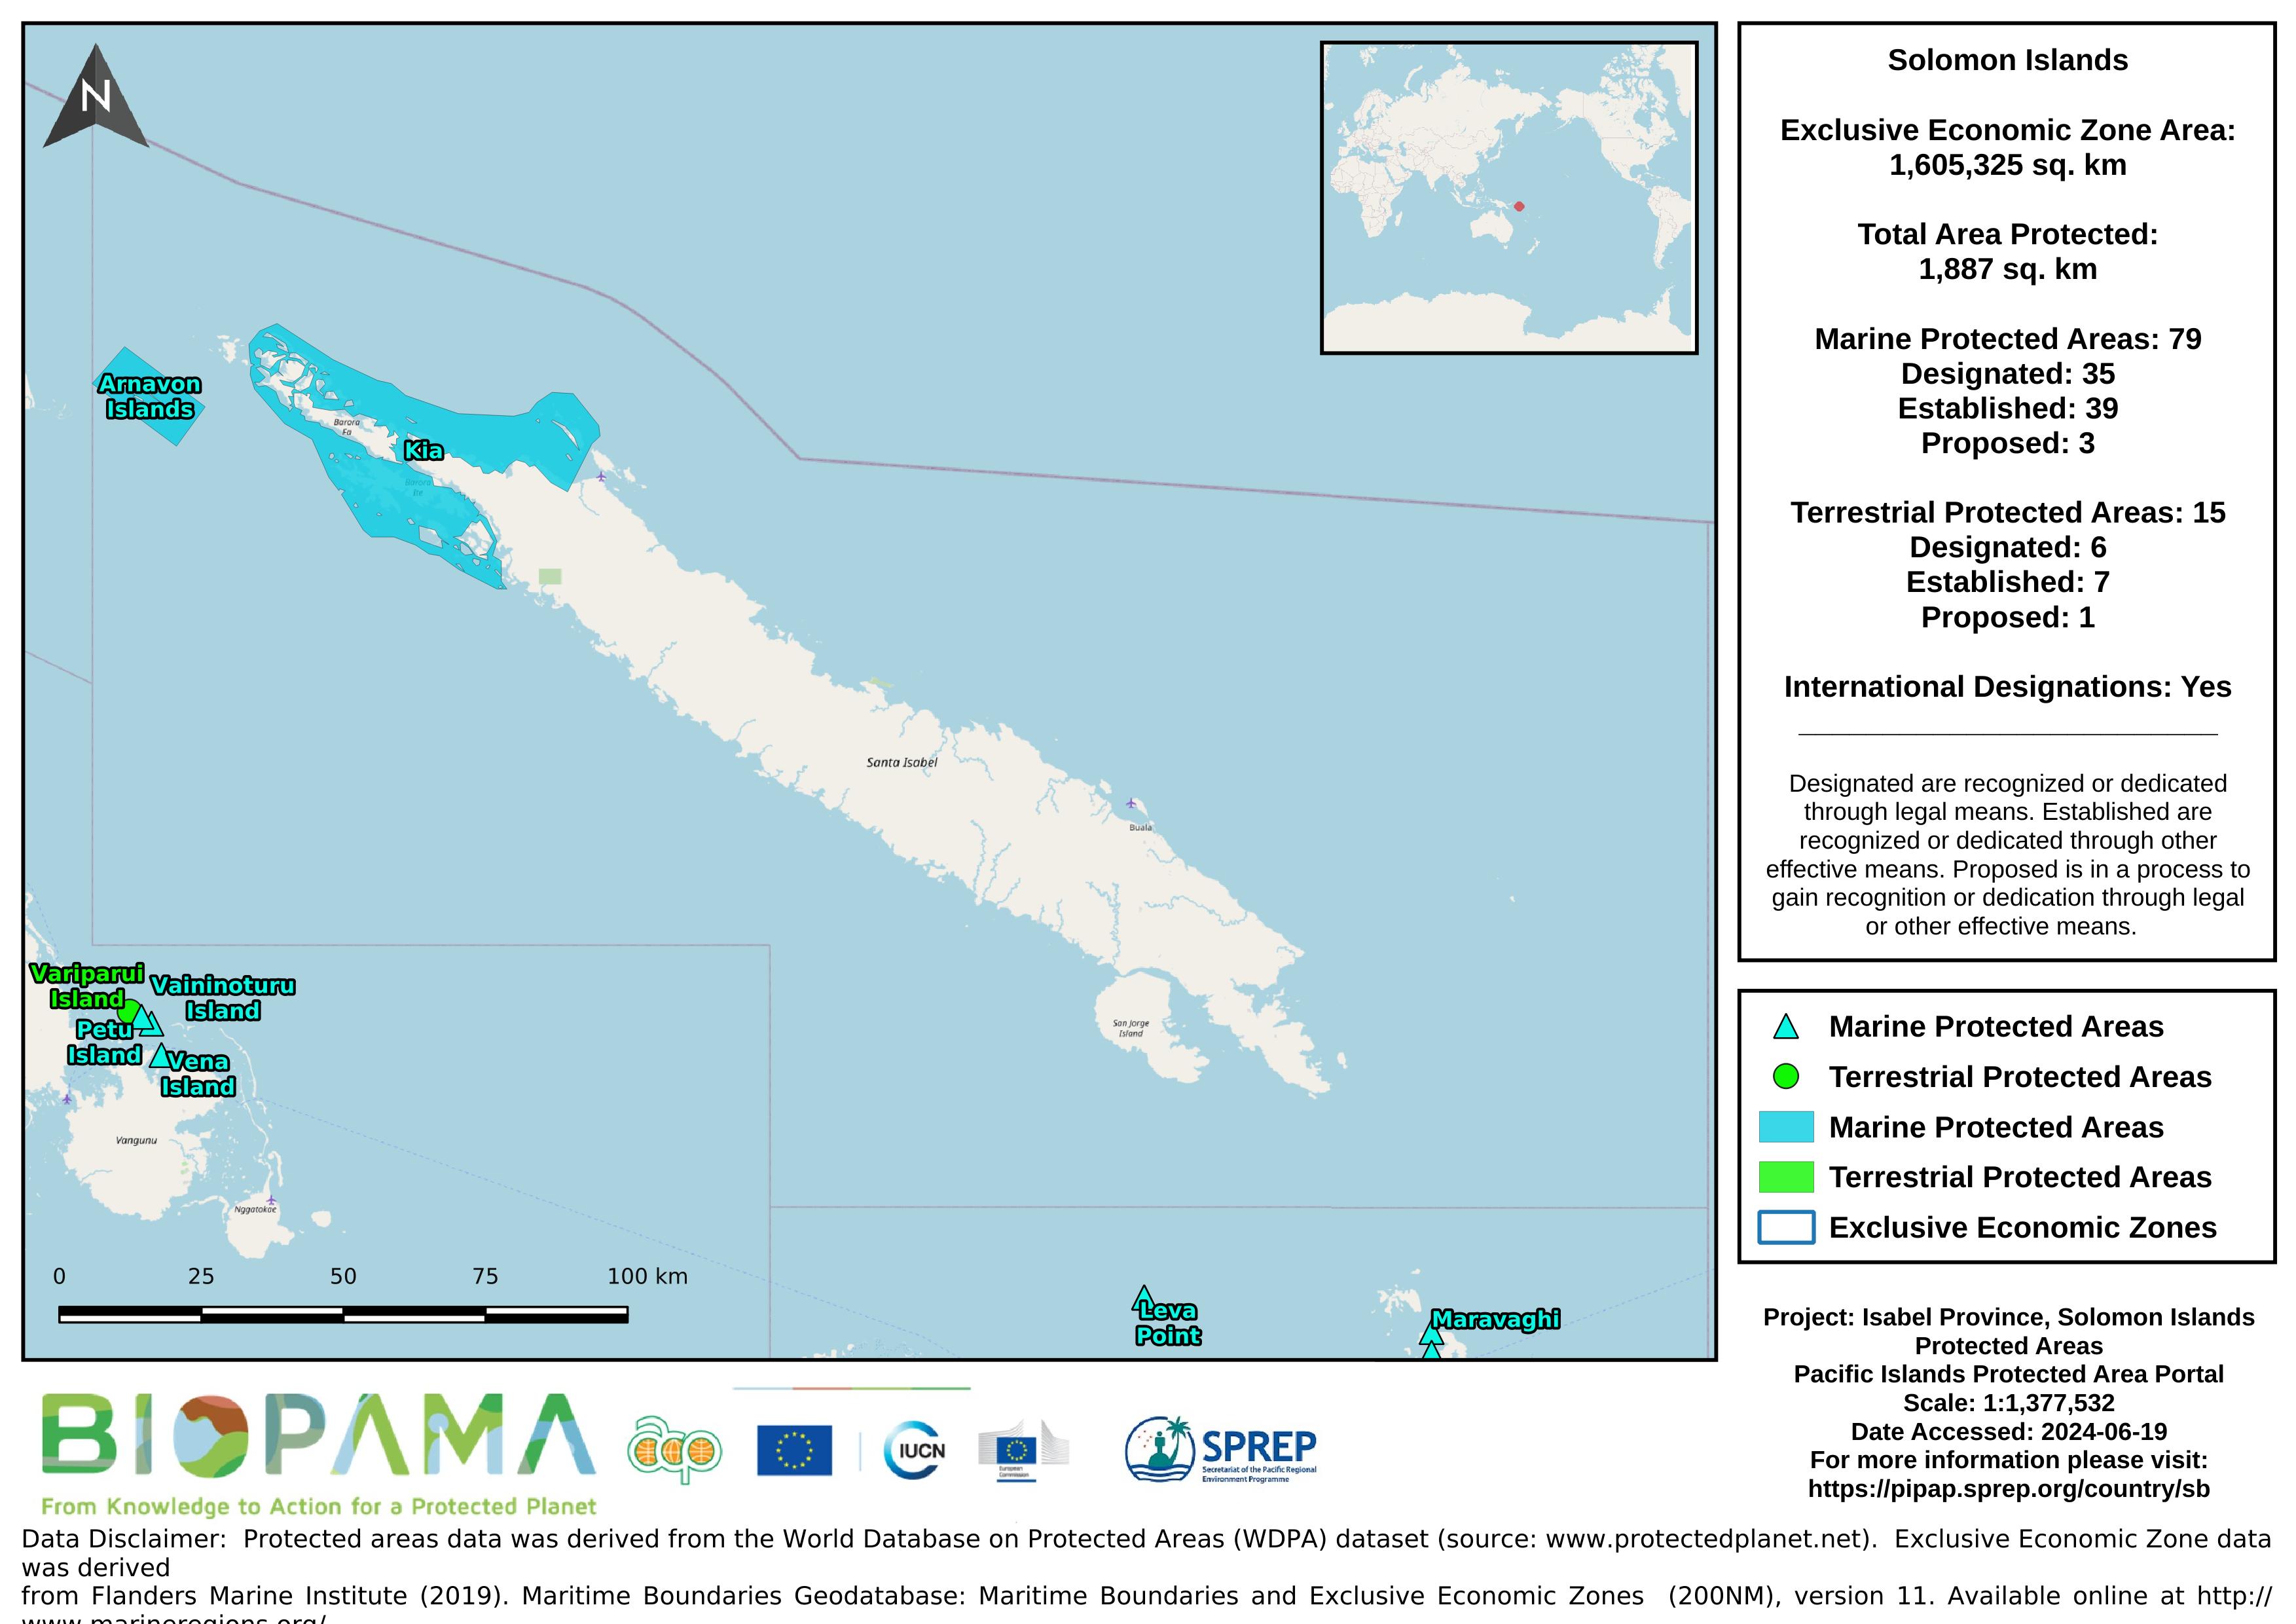
Map of the protected areas for Isabel province in the Solomon Islands with country-level summary statistics on the amount of area under protection, count for each type of protected area (terrestrial or marine), and the count of their designation.
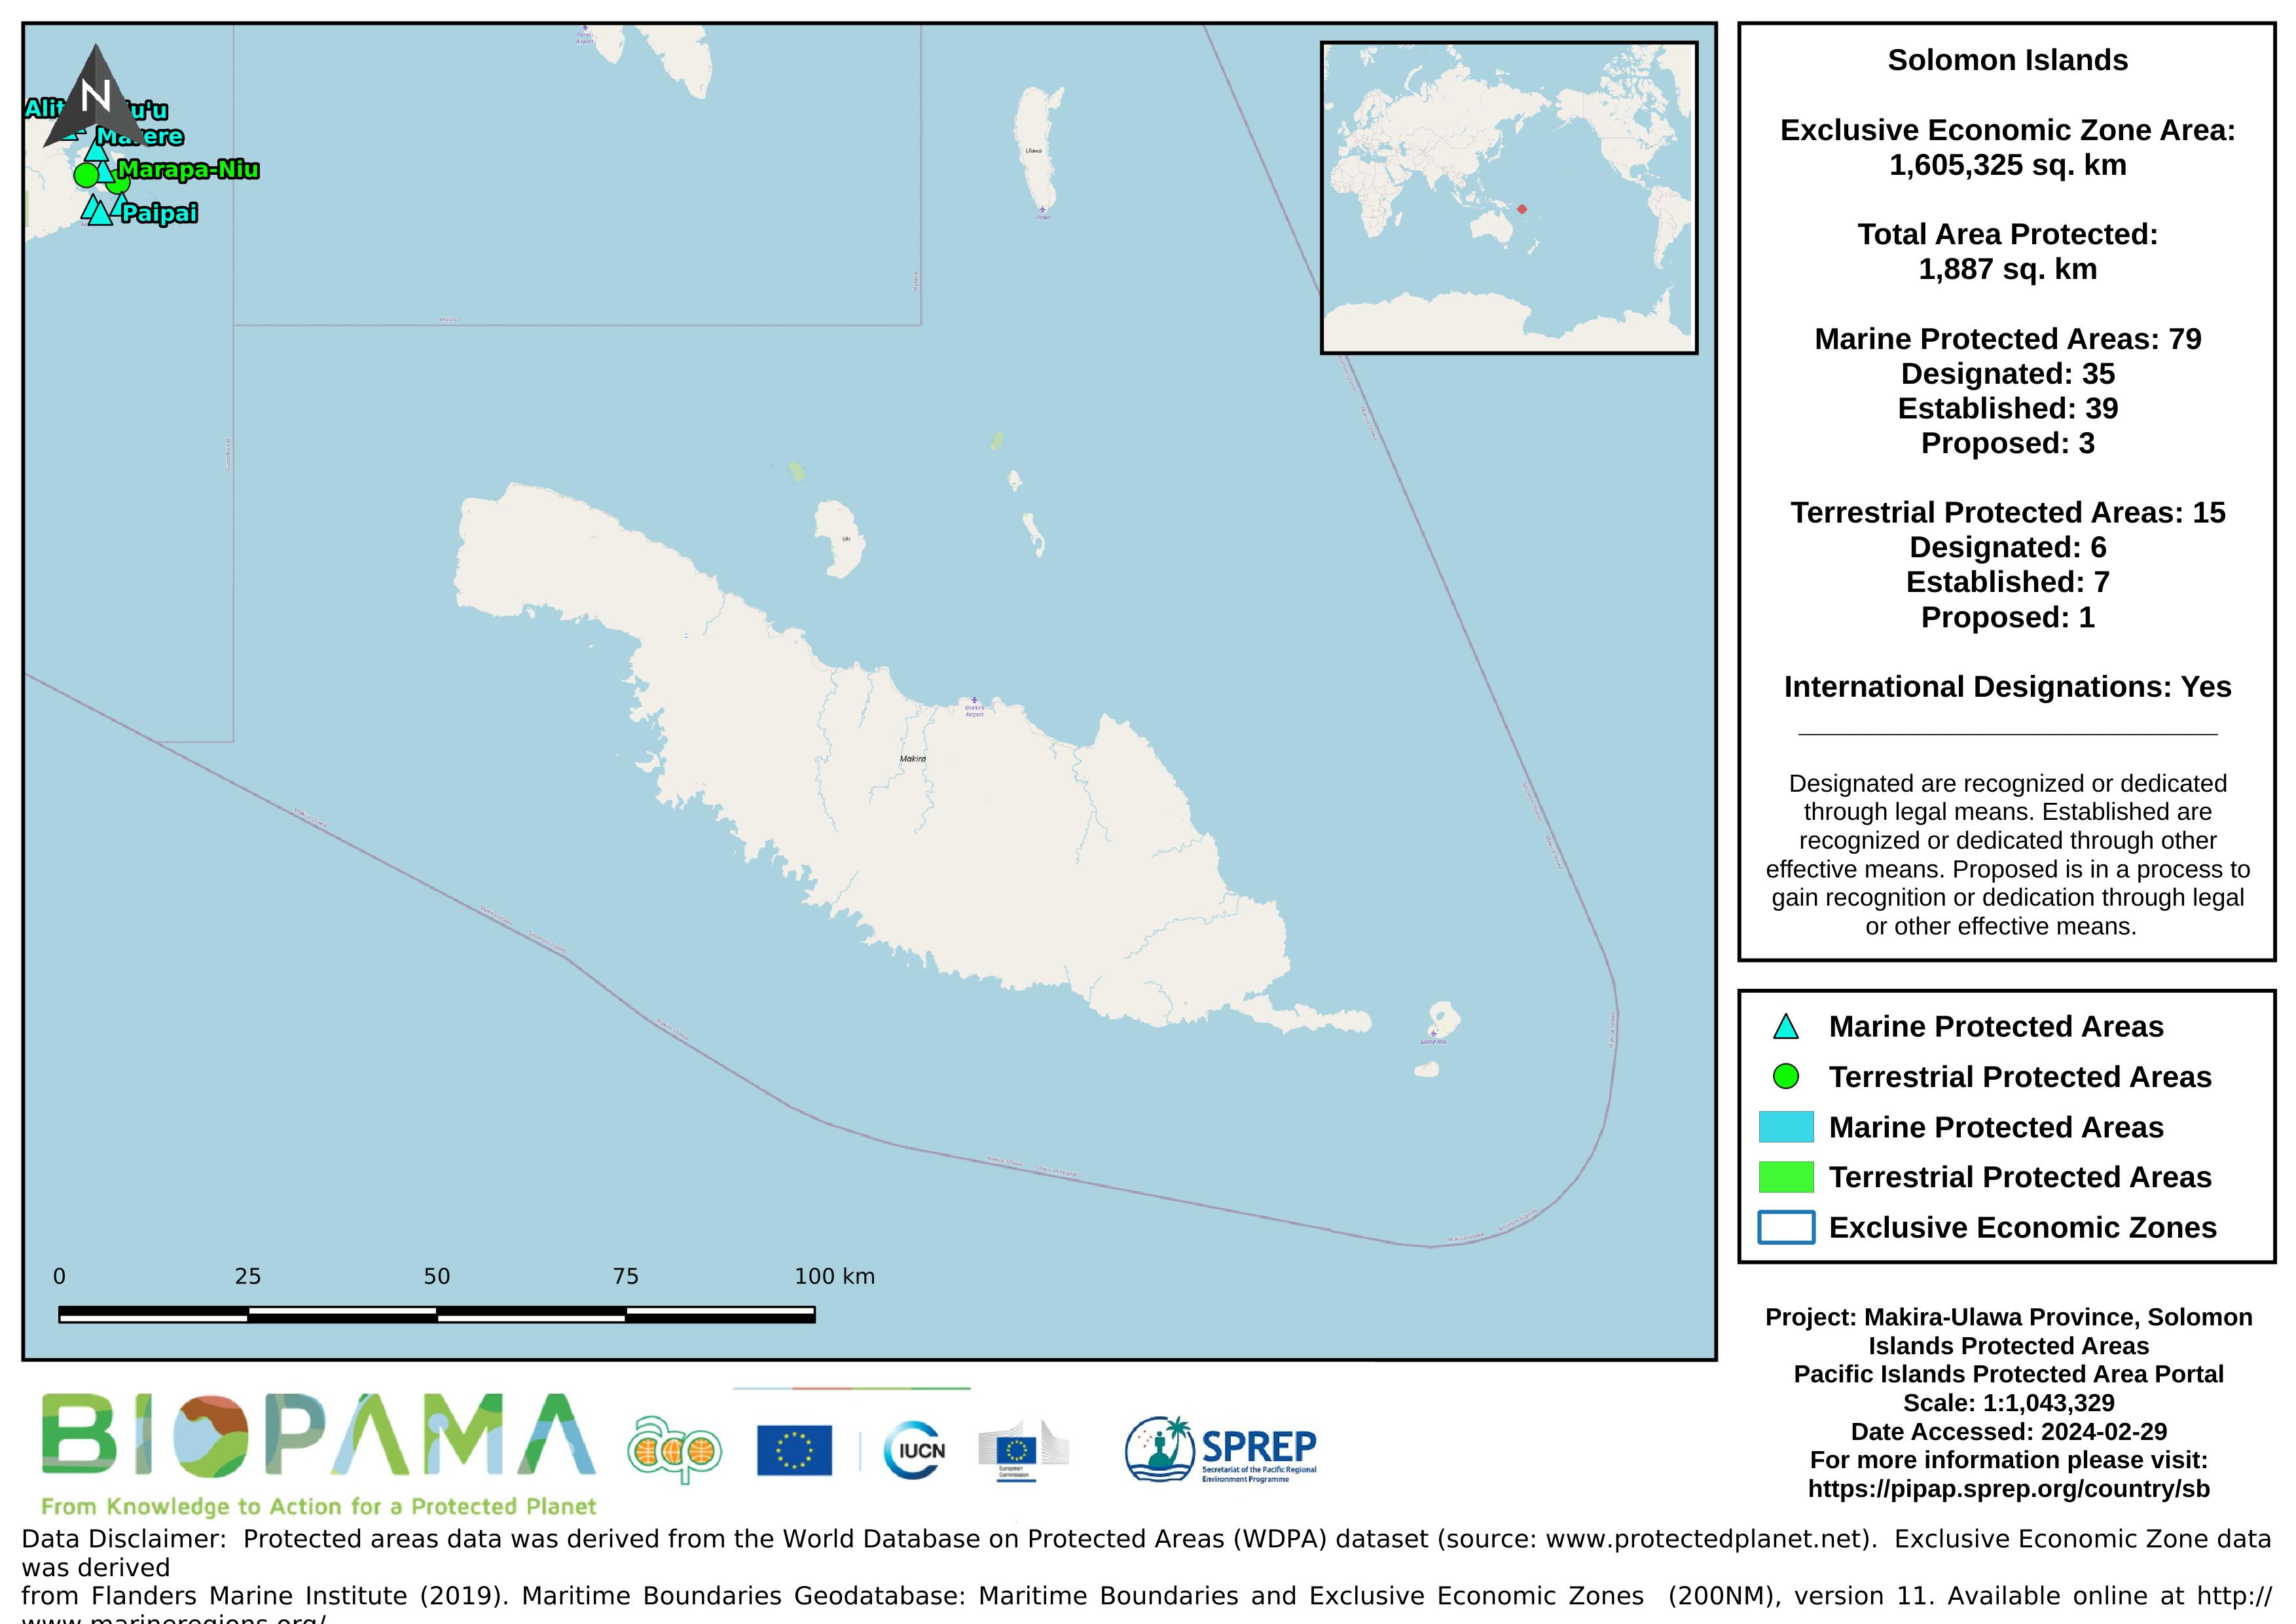
Map of the protected areas for Makira-Ulawa province in the Solomon Islands with country-level summary statistics on the amount of area under protection, count for each type of protected area (terrestrial or marine), and the count of their designation.
PowerPoint presentation on the building blocks and features of the environment data portals.
PowerPoint presentation with tips on good practices, when uploading data to the environment data portals.
Map of predictions of relative probabilities of species occurence in a global grid of half-degree latitude and longitude cell dimensions.