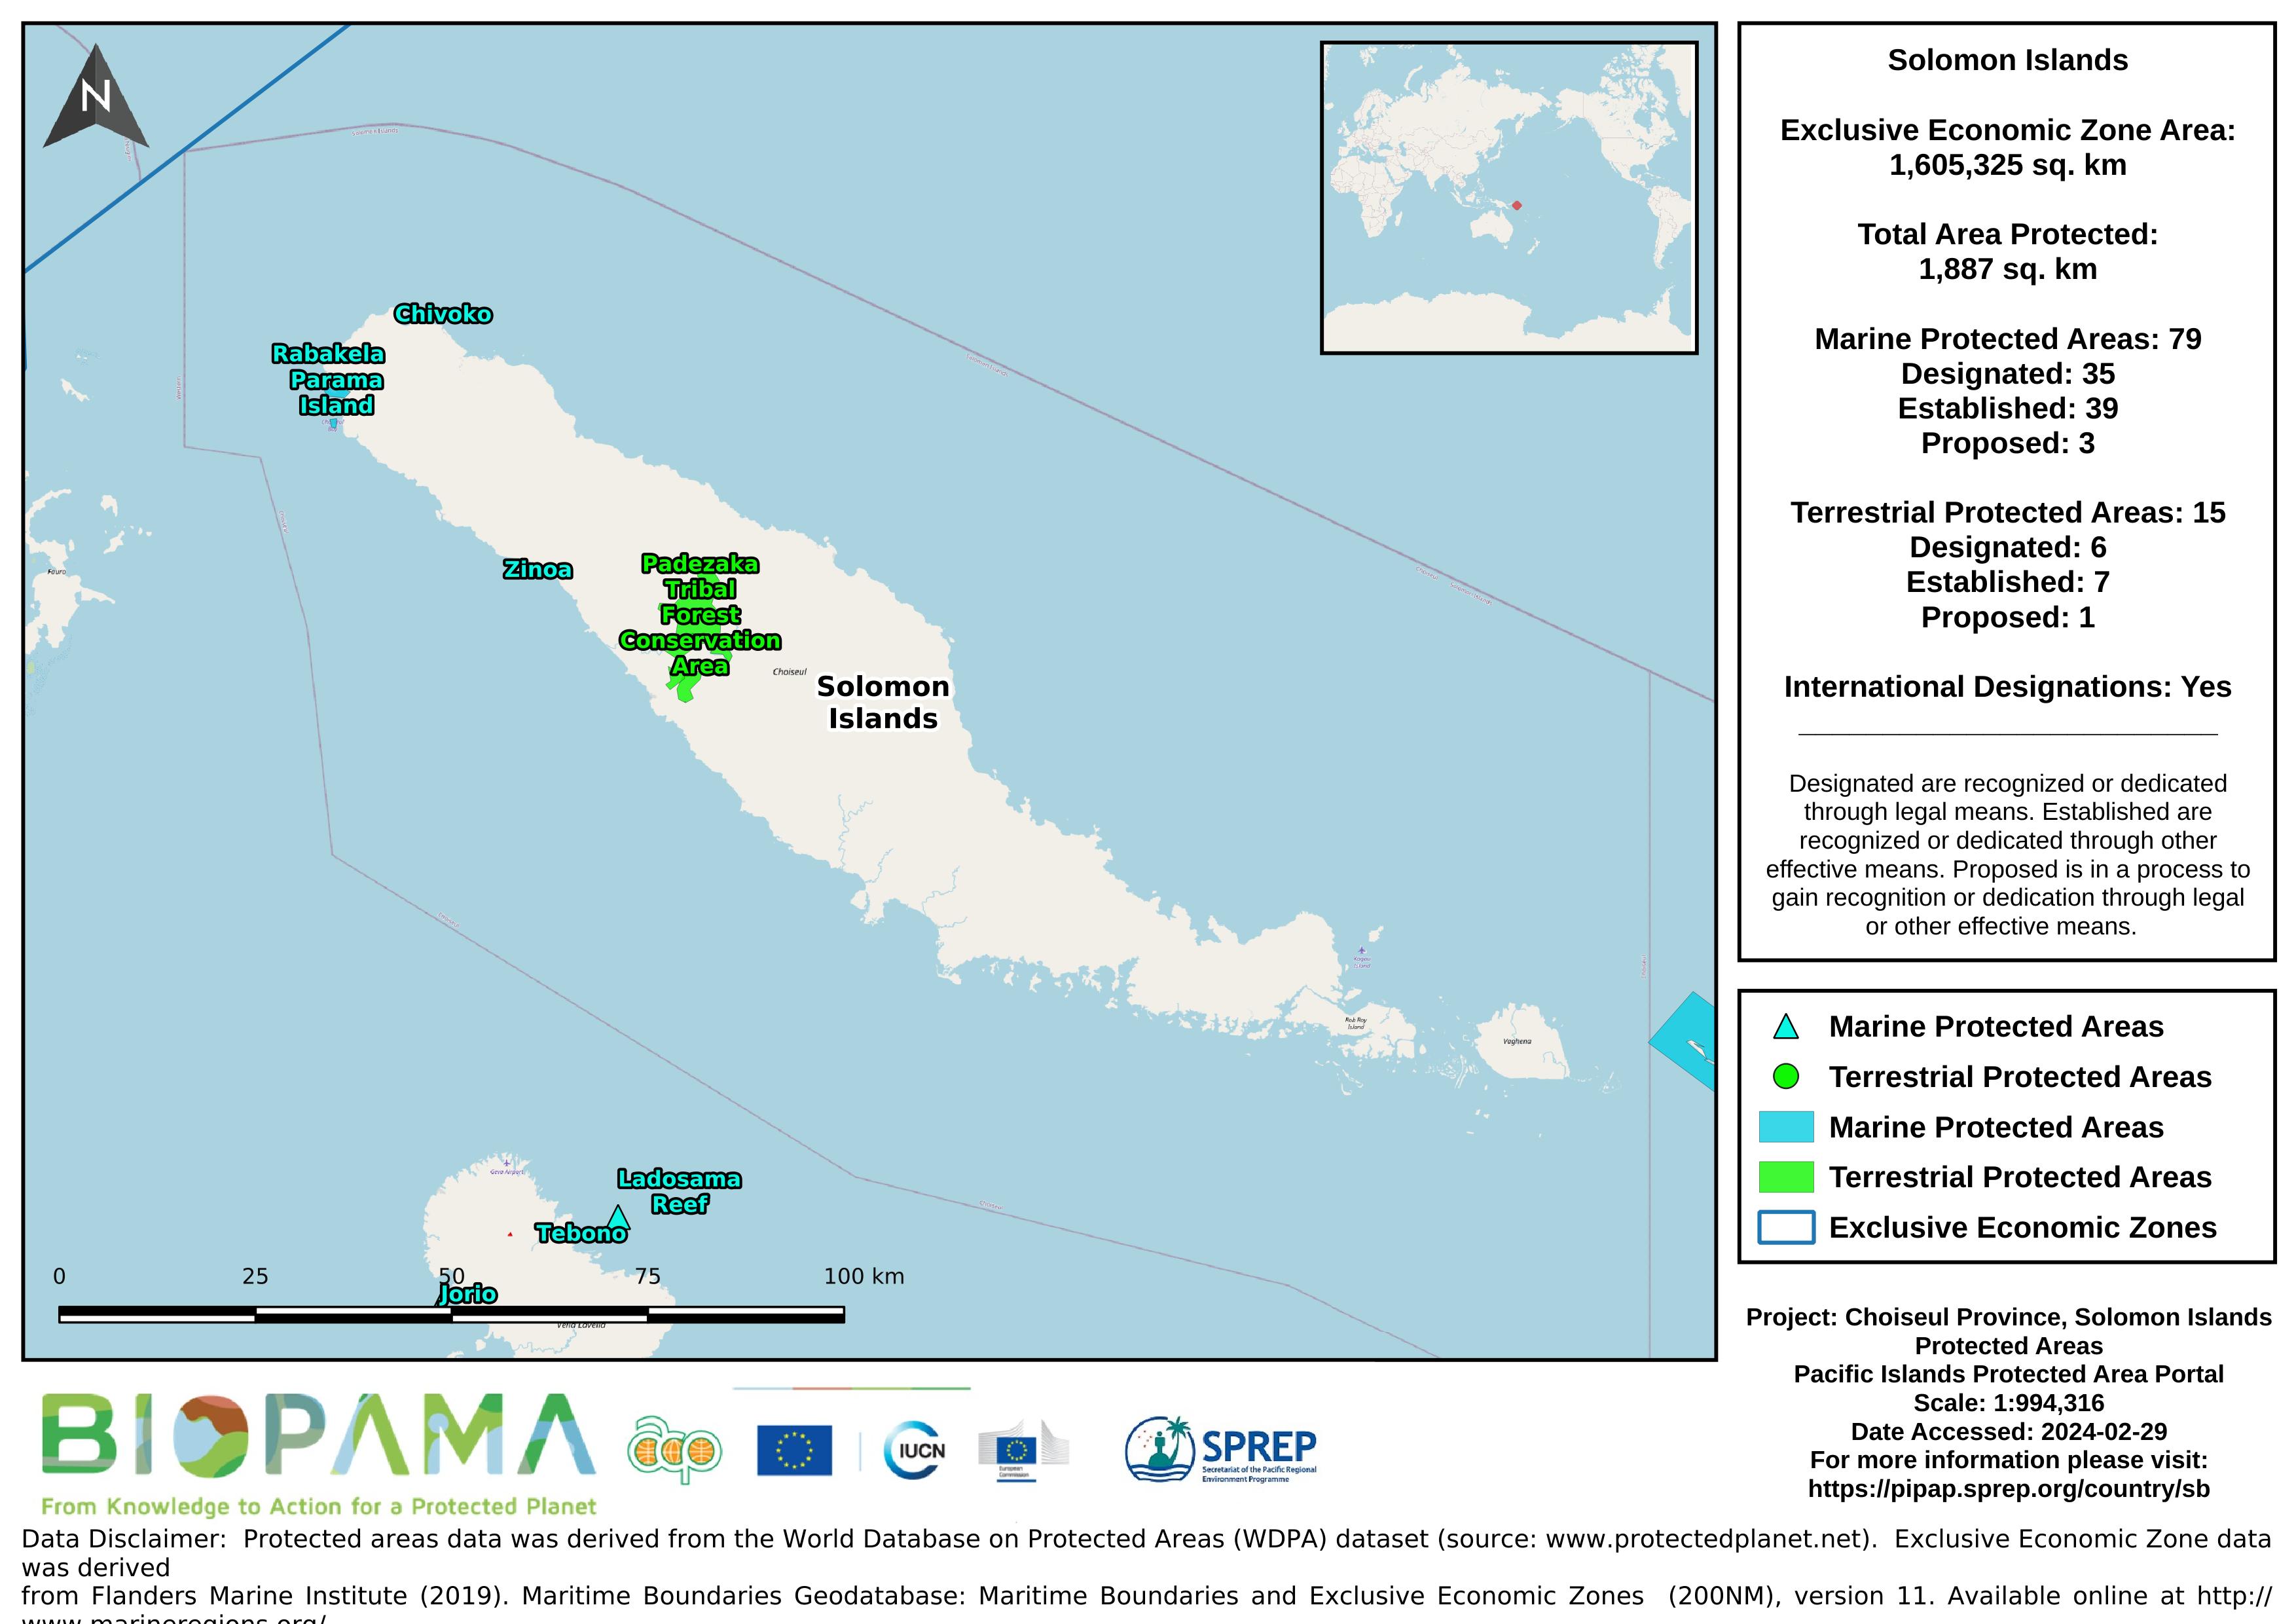
Map of the protected areas for Choiseul province in the Solomon Islands with country-level summary statistics on the amount of area under protection, count for each type of protected area (terrestrial or marine), and the count of their designation.
Map of the protected areas for Choiseul province in the Solomon Islands with country-level summary statistics on the amount of area under protection, count for each type of protected area (terrestrial or marine), and the count of their designation.
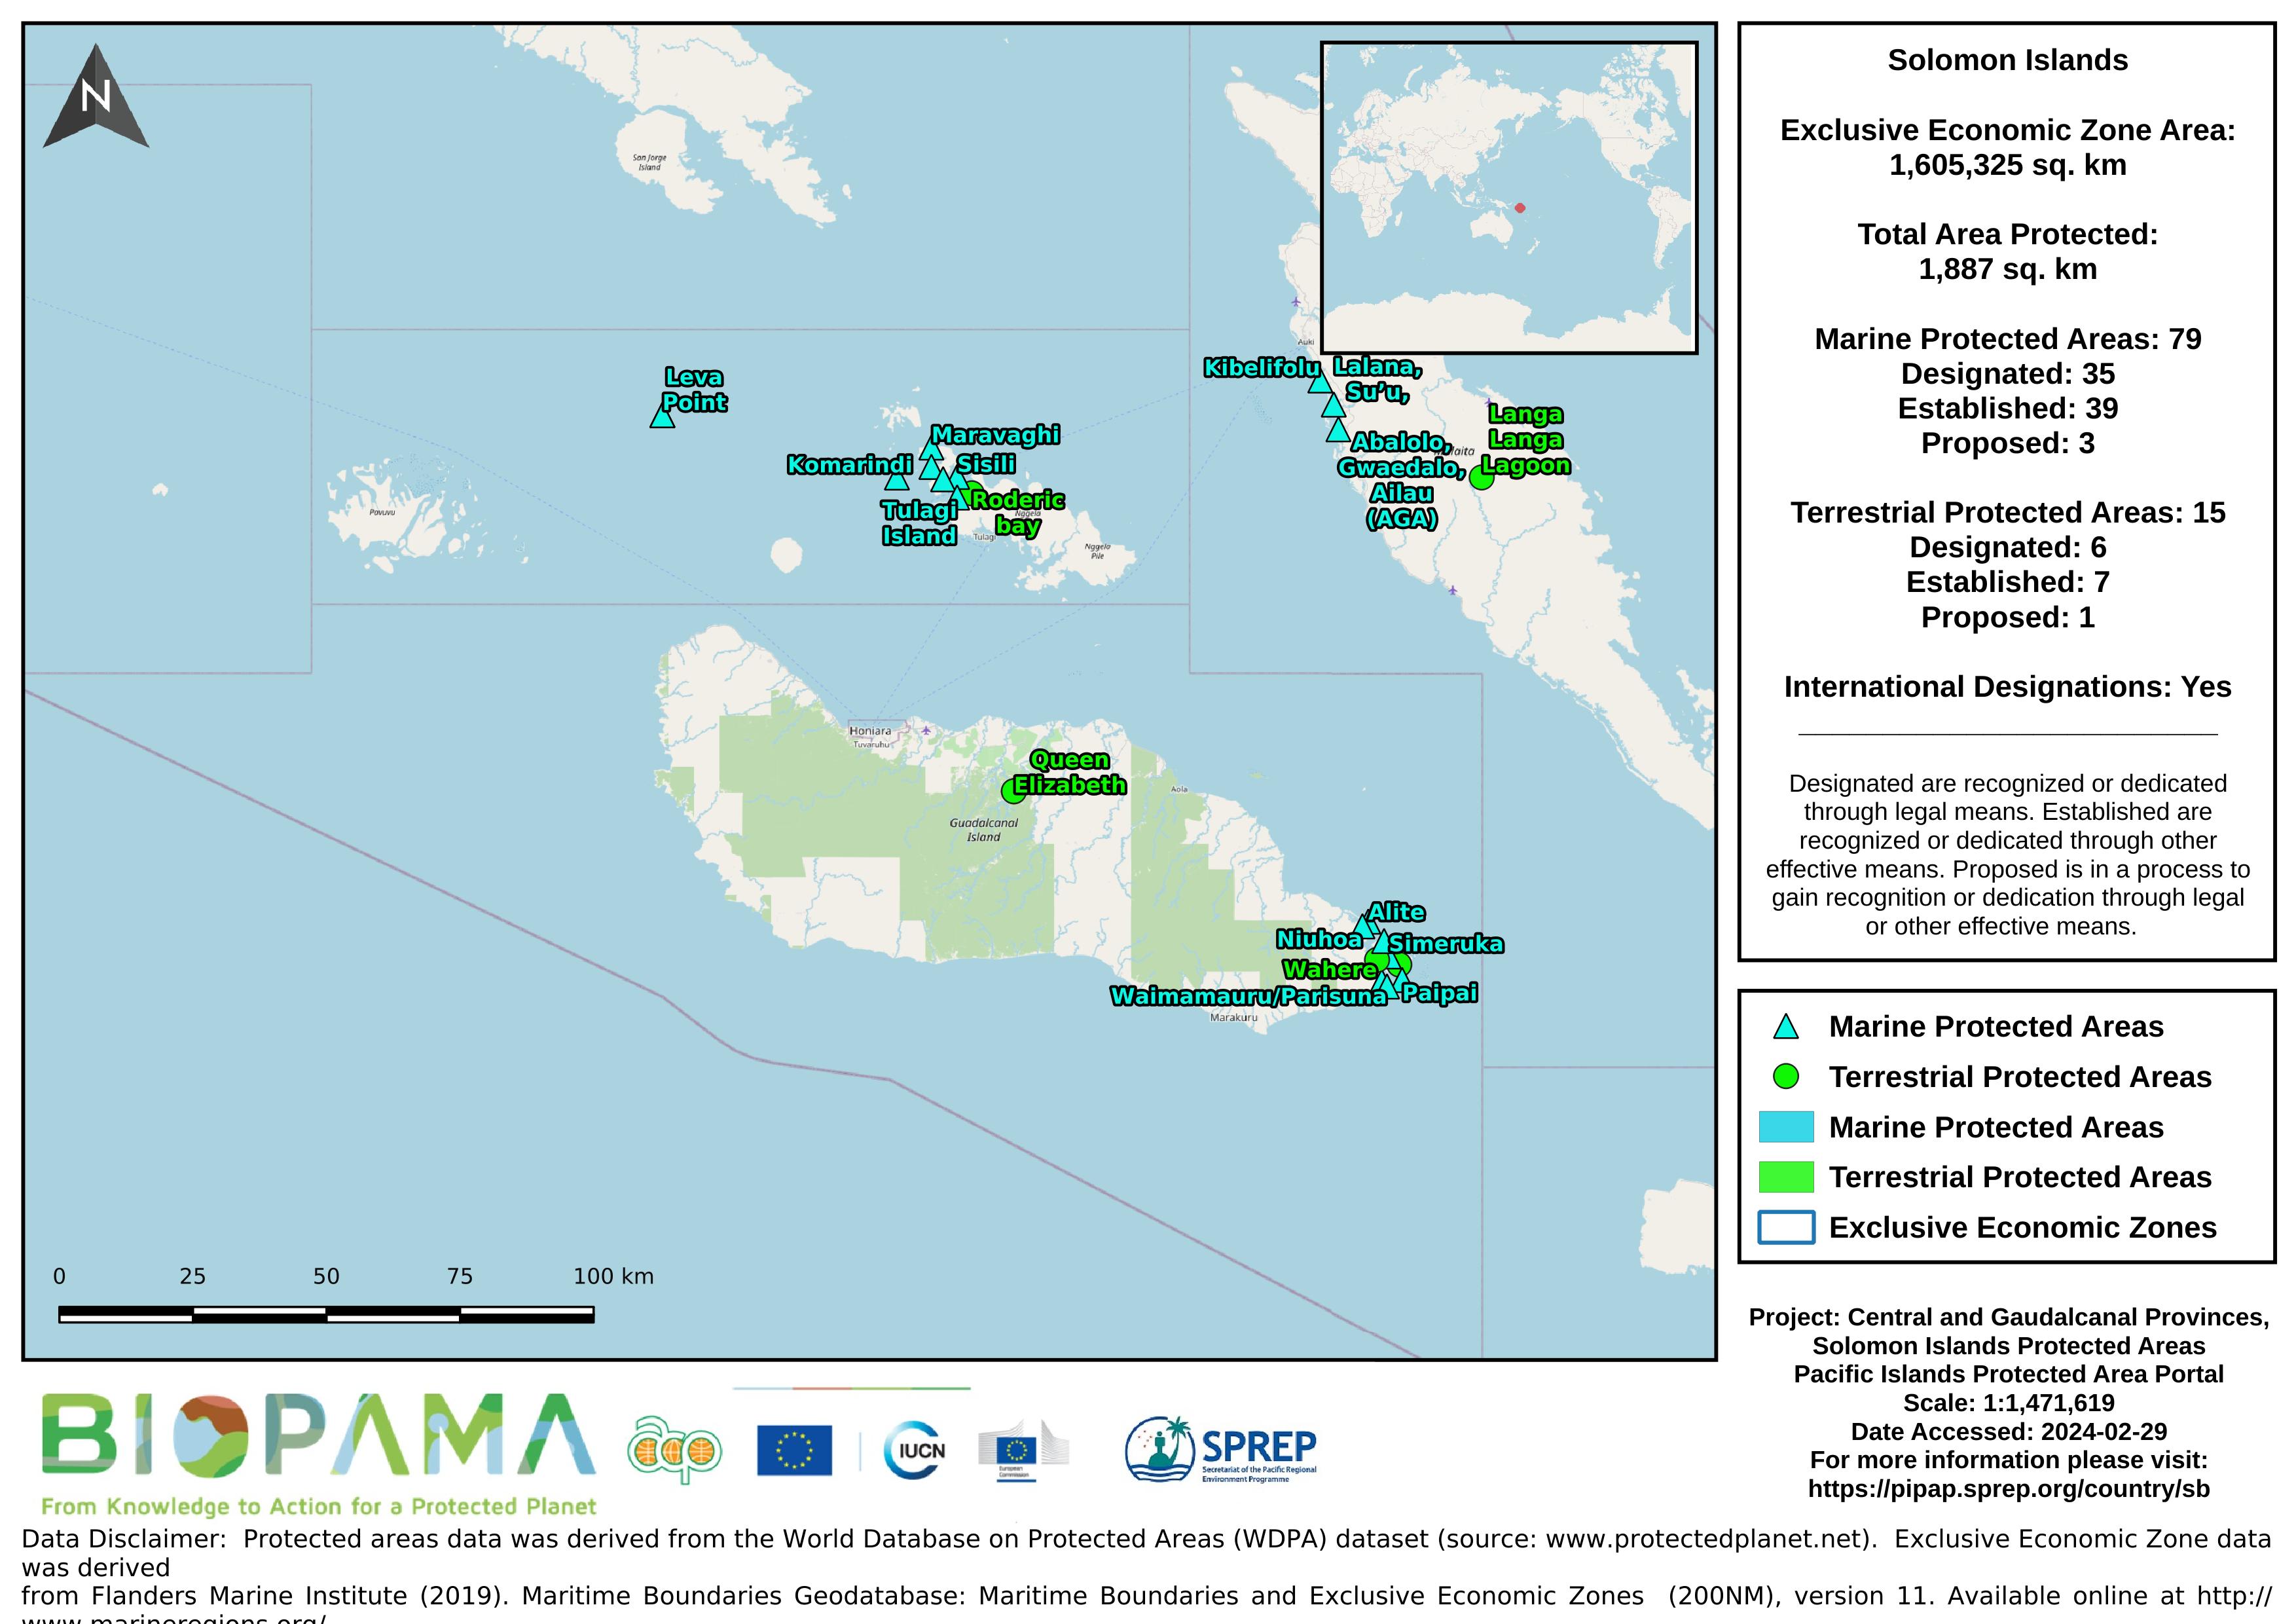
Map of the protected areas for Guadalcanal and Central provinces in the Solomon Islands with country-level summary statistics on the amount of area under protection, count for each type of protected area (terrestrial or marine), and the count of their designation.
Map of the protected areas for Guadalcanal and Central provinces in the Solomon Islands with country-level summary statistics on the amount of area under protection, count for each type of protected area (terrestrial or marine), and the count of their designation.
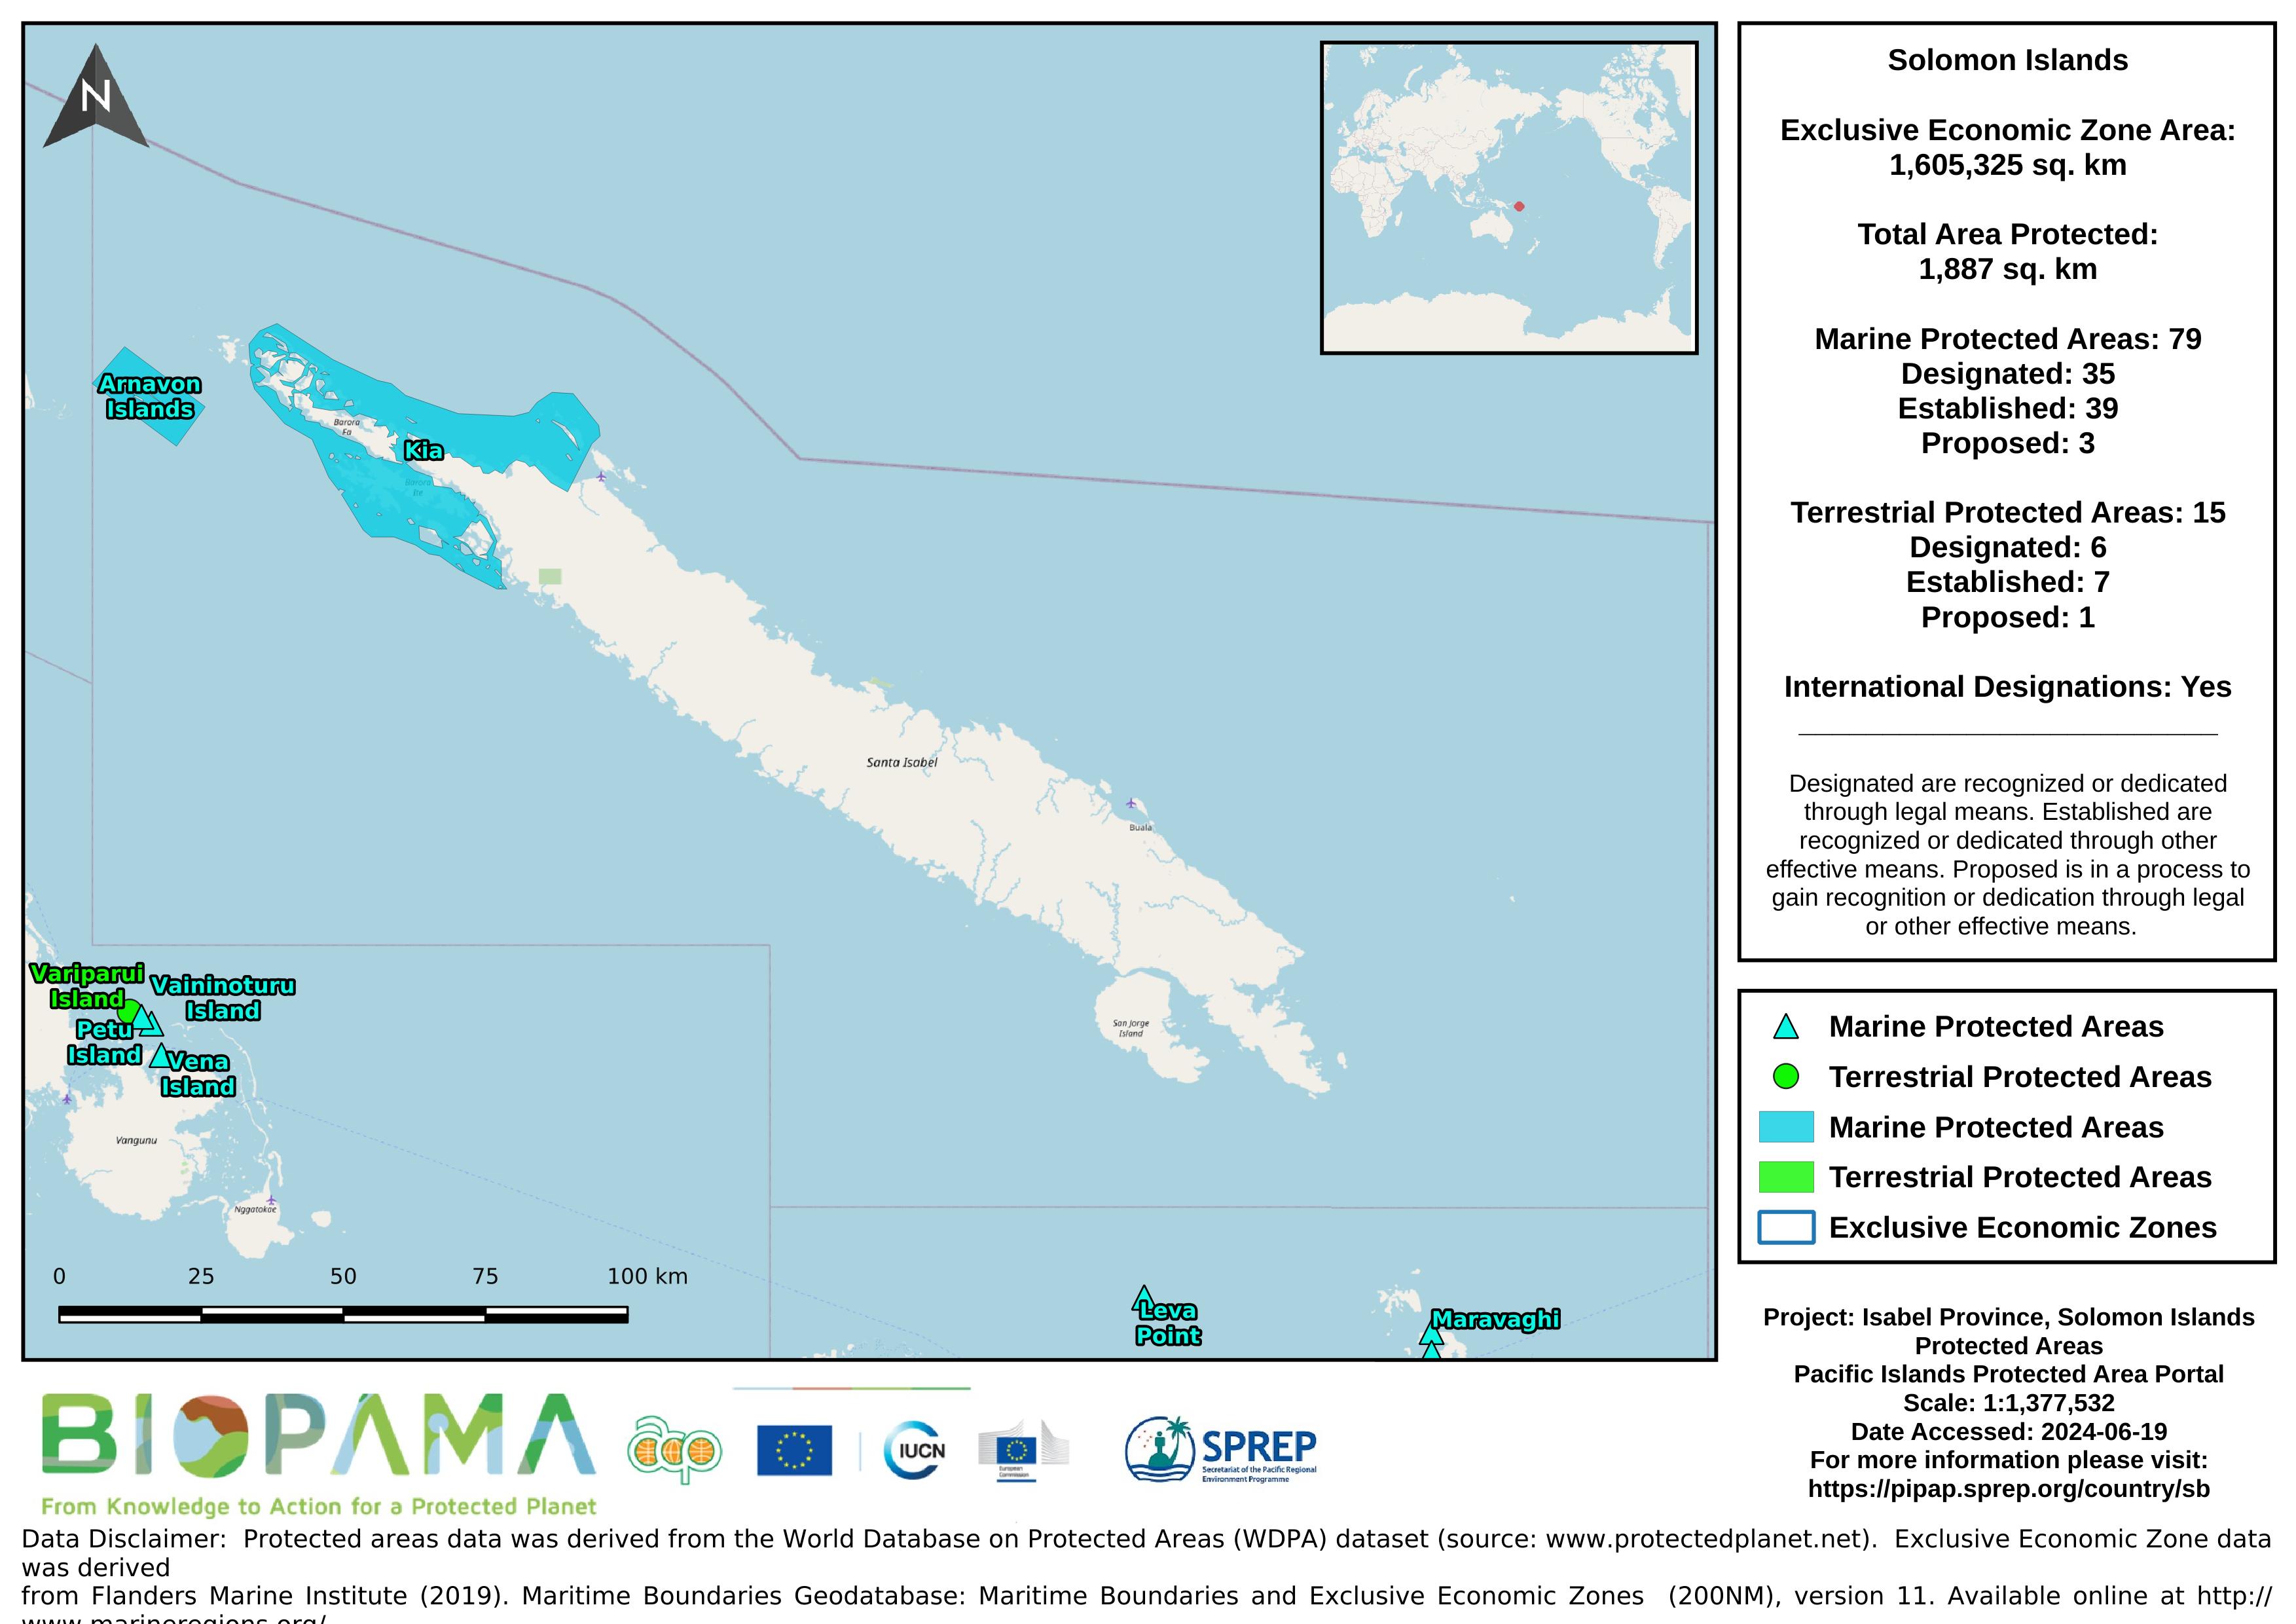
Map of the protected areas for Isabel province in the Solomon Islands with country-level summary statistics on the amount of area under protection, count for each type of protected area (terrestrial or marine), and the count of their designation.
Map of the protected areas for Isabel province in the Solomon Islands with country-level summary statistics on the amount of area under protection, count for each type of protected area (terrestrial or marine), and the count of their designation.
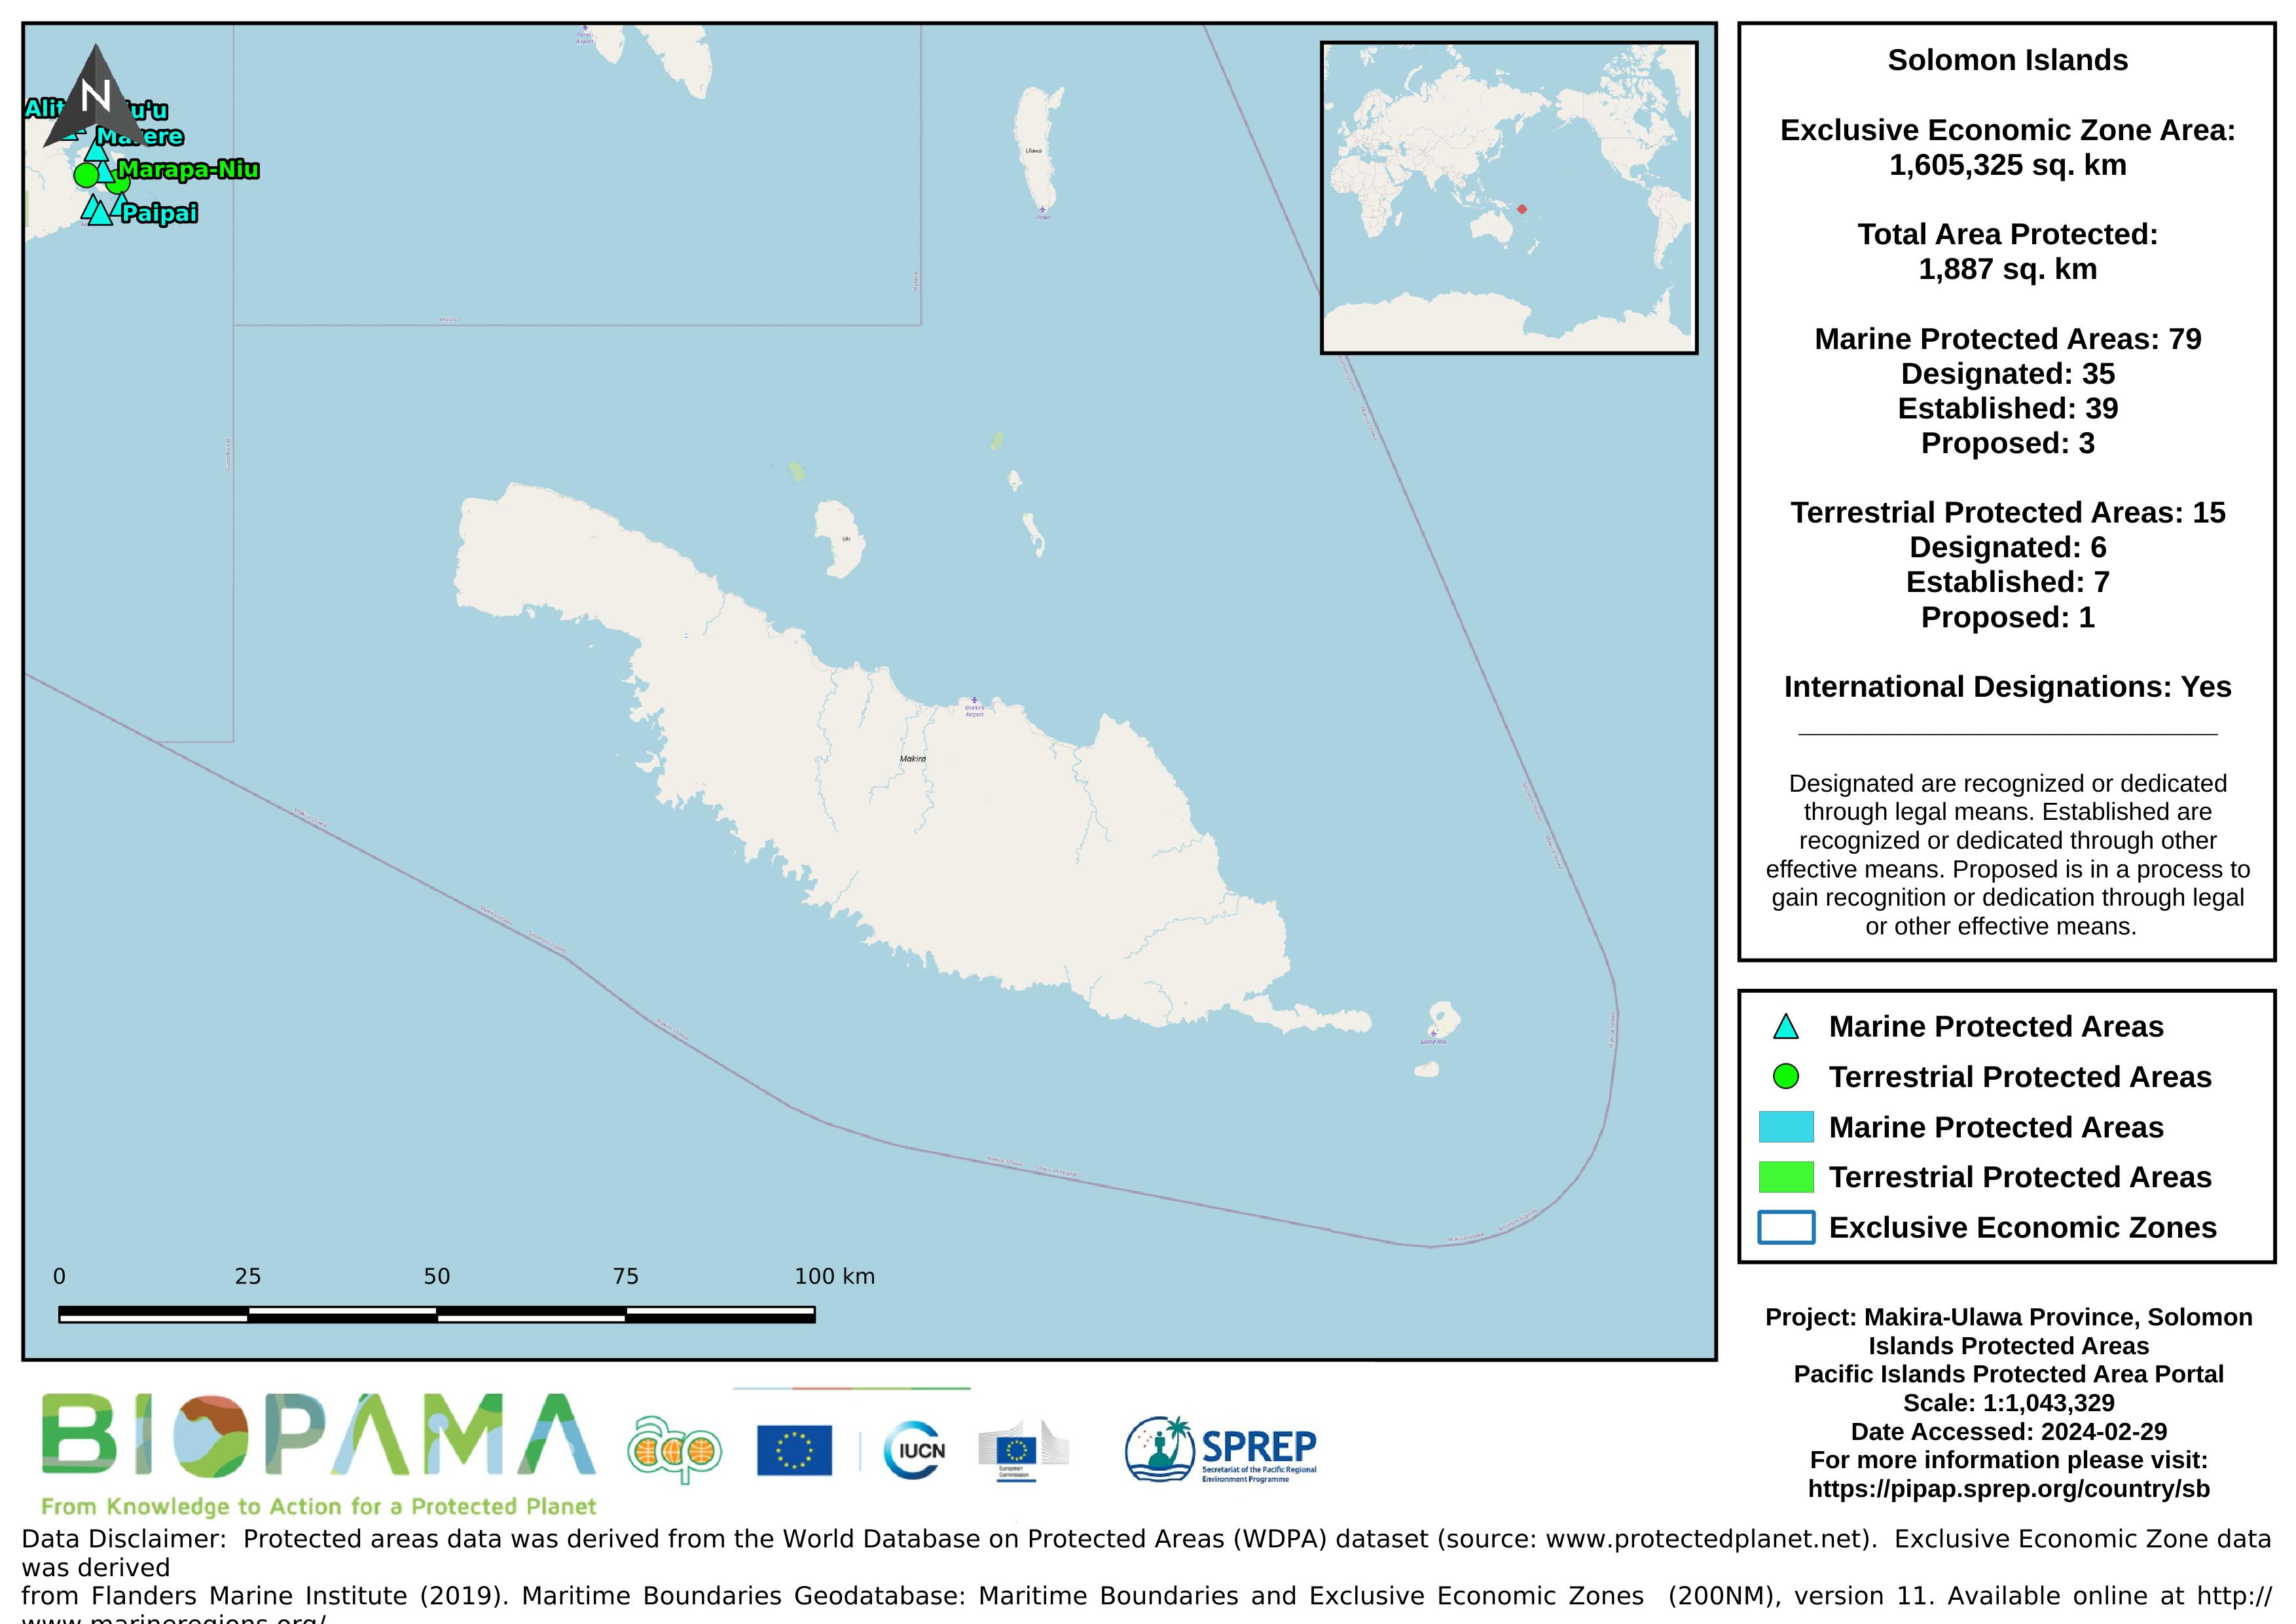
Map of the protected areas for Makira-Ulawa province in the Solomon Islands with country-level summary statistics on the amount of area under protection, count for each type of protected area (terrestrial or marine), and the count of their designation.
Map of the protected areas for Makira-Ulawa province in the Solomon Islands with country-level summary statistics on the amount of area under protection, count for each type of protected area (terrestrial or marine), and the count of their designation.
This is the report for the Reefs at Risk Revisited analysis. Reefs at Risk Revisited is a high-resolution update of the original global analysis, Reefs at Risk: A Map-Based Indicator of Threats to the World’s Coral Reefs. Reefs at Risk Revisited uses a global map of coral reefs at 500-m resolution, which is 64 times more detailed than the 4-km resolution map used in the 1998 analysis, and benefits from improvements in many global data sets used to evaluate threats to reefs (most threat data are at 1 km resolution, which is 16 times more detailed than those used in the 1998 analysis).
This dataset contains GIS data (raster and shapefiles) for the local threats to coral reefs: coastal development, integrated local, marine pollution, overfishing, and watershed pollution.
The Global Mangrove Watch (GMW) is a collaboration between Aberystwyth University (U.K.), solo Earth Observation (soloEO; Japan), Wetlands International the World Conservation Monitoring Centre (UNEP-WCMC) and the Japan Aerospace Exploration Agency (JAXA).
Conservation International, GRID-Arendal and Geoscience Australia recently collaborated to produce a map of the global distribution of seafloor geomorphic features. The global seafloor geomorphic features map represents an important contribution towards the understanding of the distribution of blue habitats. Certain geomorphic feature are known to be good surrogates for biodiversity. For example, seamounts support a different suite of species to abyssal plains.
Map of predictions of relative probabilities of species occurence in a global grid of half-degree latitude and longitude cell dimensions.
Map of predictions of relative probabilities of benthic marine species occurence in a global grid of half-degree latitude and longitude cell dimensions.
Map of predictions of relative probabilities of pelagic species occurence in a global grid of half-degree latitude and longitude cell dimensions.
Map of artisanal fishing intensity based on data from the global map of human impacts (2008) (https://www.nceas.ucsb.edu/globalmarine2008/impacts).
Map developed by MACBIO for the bioregions workshop 2018. Chlorophyl-a concentration is an important proxy which is routinely measured and is considered a "core" parameter of global physical-biological oceanic models. Map is based on data from NASA's Aqua satellite.
The map contains the global distribution of habitat suitability for seven suborders of cold water octocoral found deeper than 50m. Map is based on data from Yesson et al (2012) Global habitat suitability of cold water Octocorals, Journal of Biogeography 39, 1278-1292.
The map displays the number of coral species that are expected to be found in each grid cell that contains coral reefs as identified by the Millenium Reefs project. The map is based on a spatial data base of geographic range boundaries compiled by the Australian Research Council Centre of Excellence for Coral Reef Studies compi