The Gridded Population of the World, Version 4 (GPWv4): Population Density, Revision 11 consists of estimates of human population density (number of persons per square kilometer) based on counts consistent with national censuses and population registers, for the years 2000, 2005, 2010, 2015, and 2020. A proportional allocation gridding algorithm, utilizing approximately 13.5 million national and sub-national administrative units, was used to assign population counts to 30 arc-second grid cells.
Dataset pertaining to a record of annual tree cover loss in the Solomon Islands from 2001 - 2017. The independent Global Forest Watch reported a total loss of tree cover (>30% crown cover) in the Solomon Islands of 144,000 ha between 2001-2017. The country lost 144kha of tree cover, equivalent to a 5.2% decrease since 2000, and 16.7Mt of CO₂ emissions.
example.com
The World Database on Protected Areas (WDPA) is the most comprehensive global database of marine and terrestrial protected areas, updated on a monthly basis, and is one of the key global biodiversity data sets being widely used by scientists, businesses, governments, International secretariats and others to inform planning, policy decisions and management.
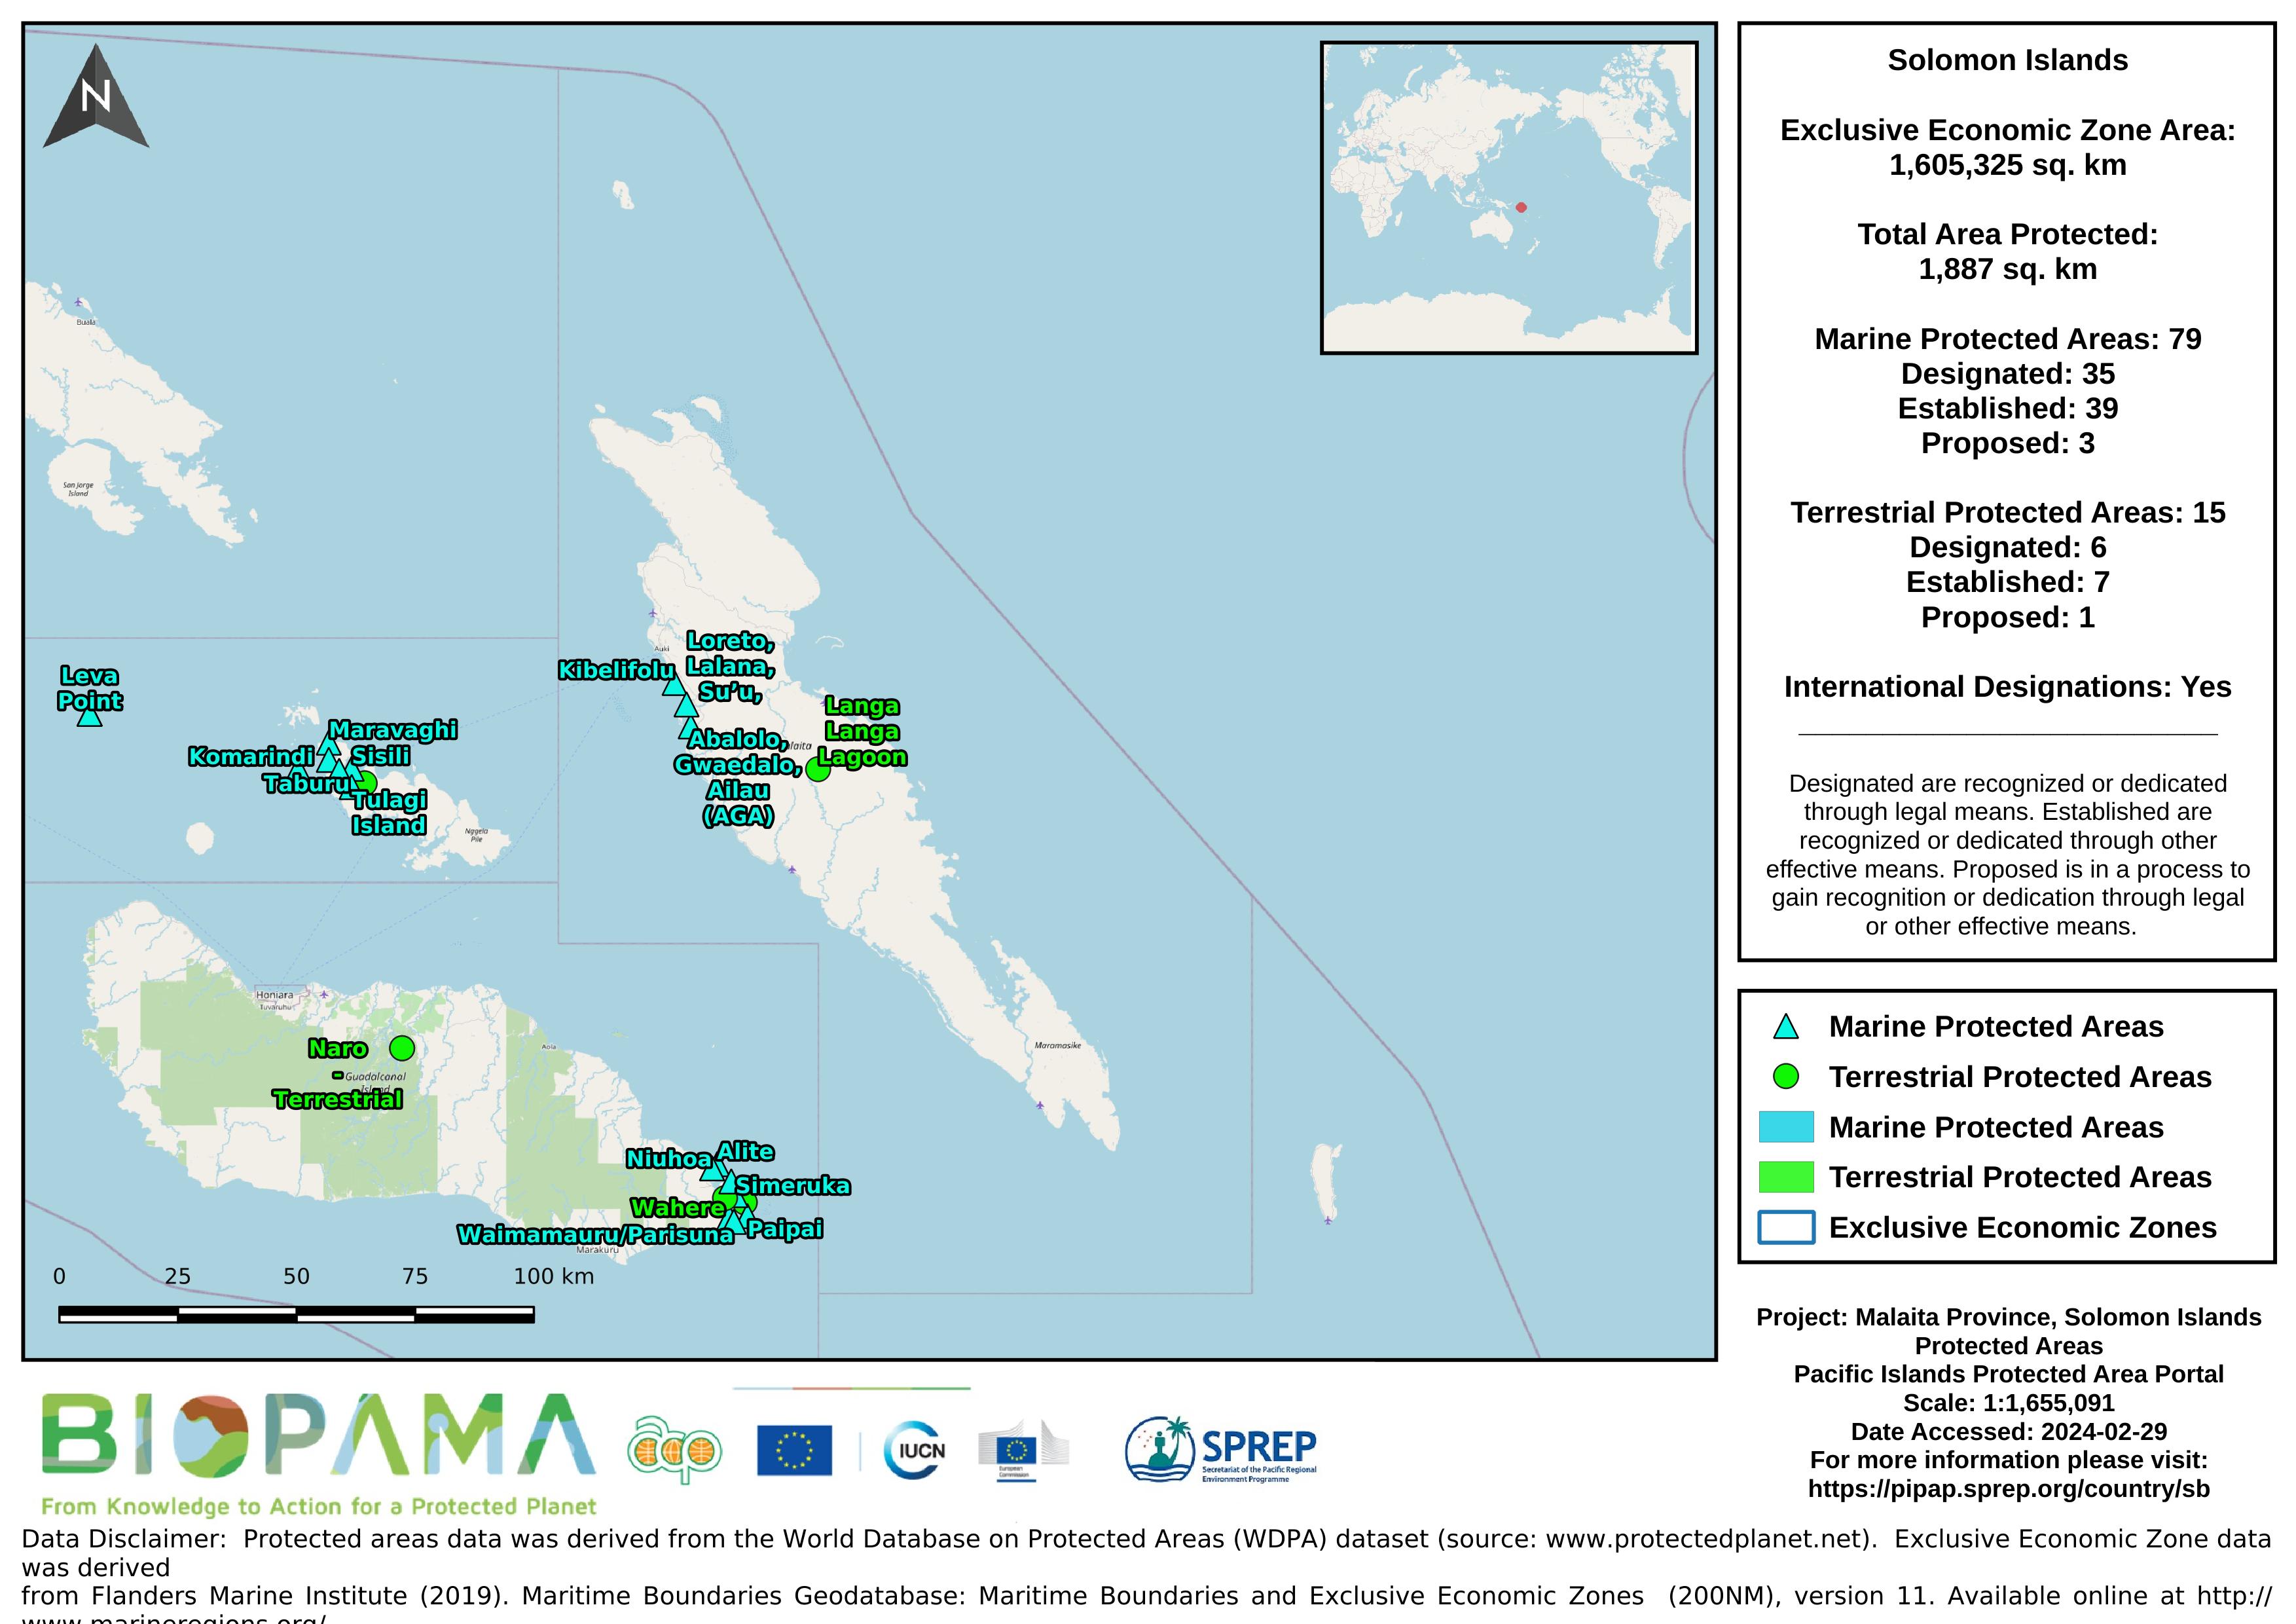
Map of the protected areas for Malaita province in the Solomon Islands with country-level summary statistics on the amount of area under protection, count for each type of protected area (terrestrial or marine), and the count of their designation.
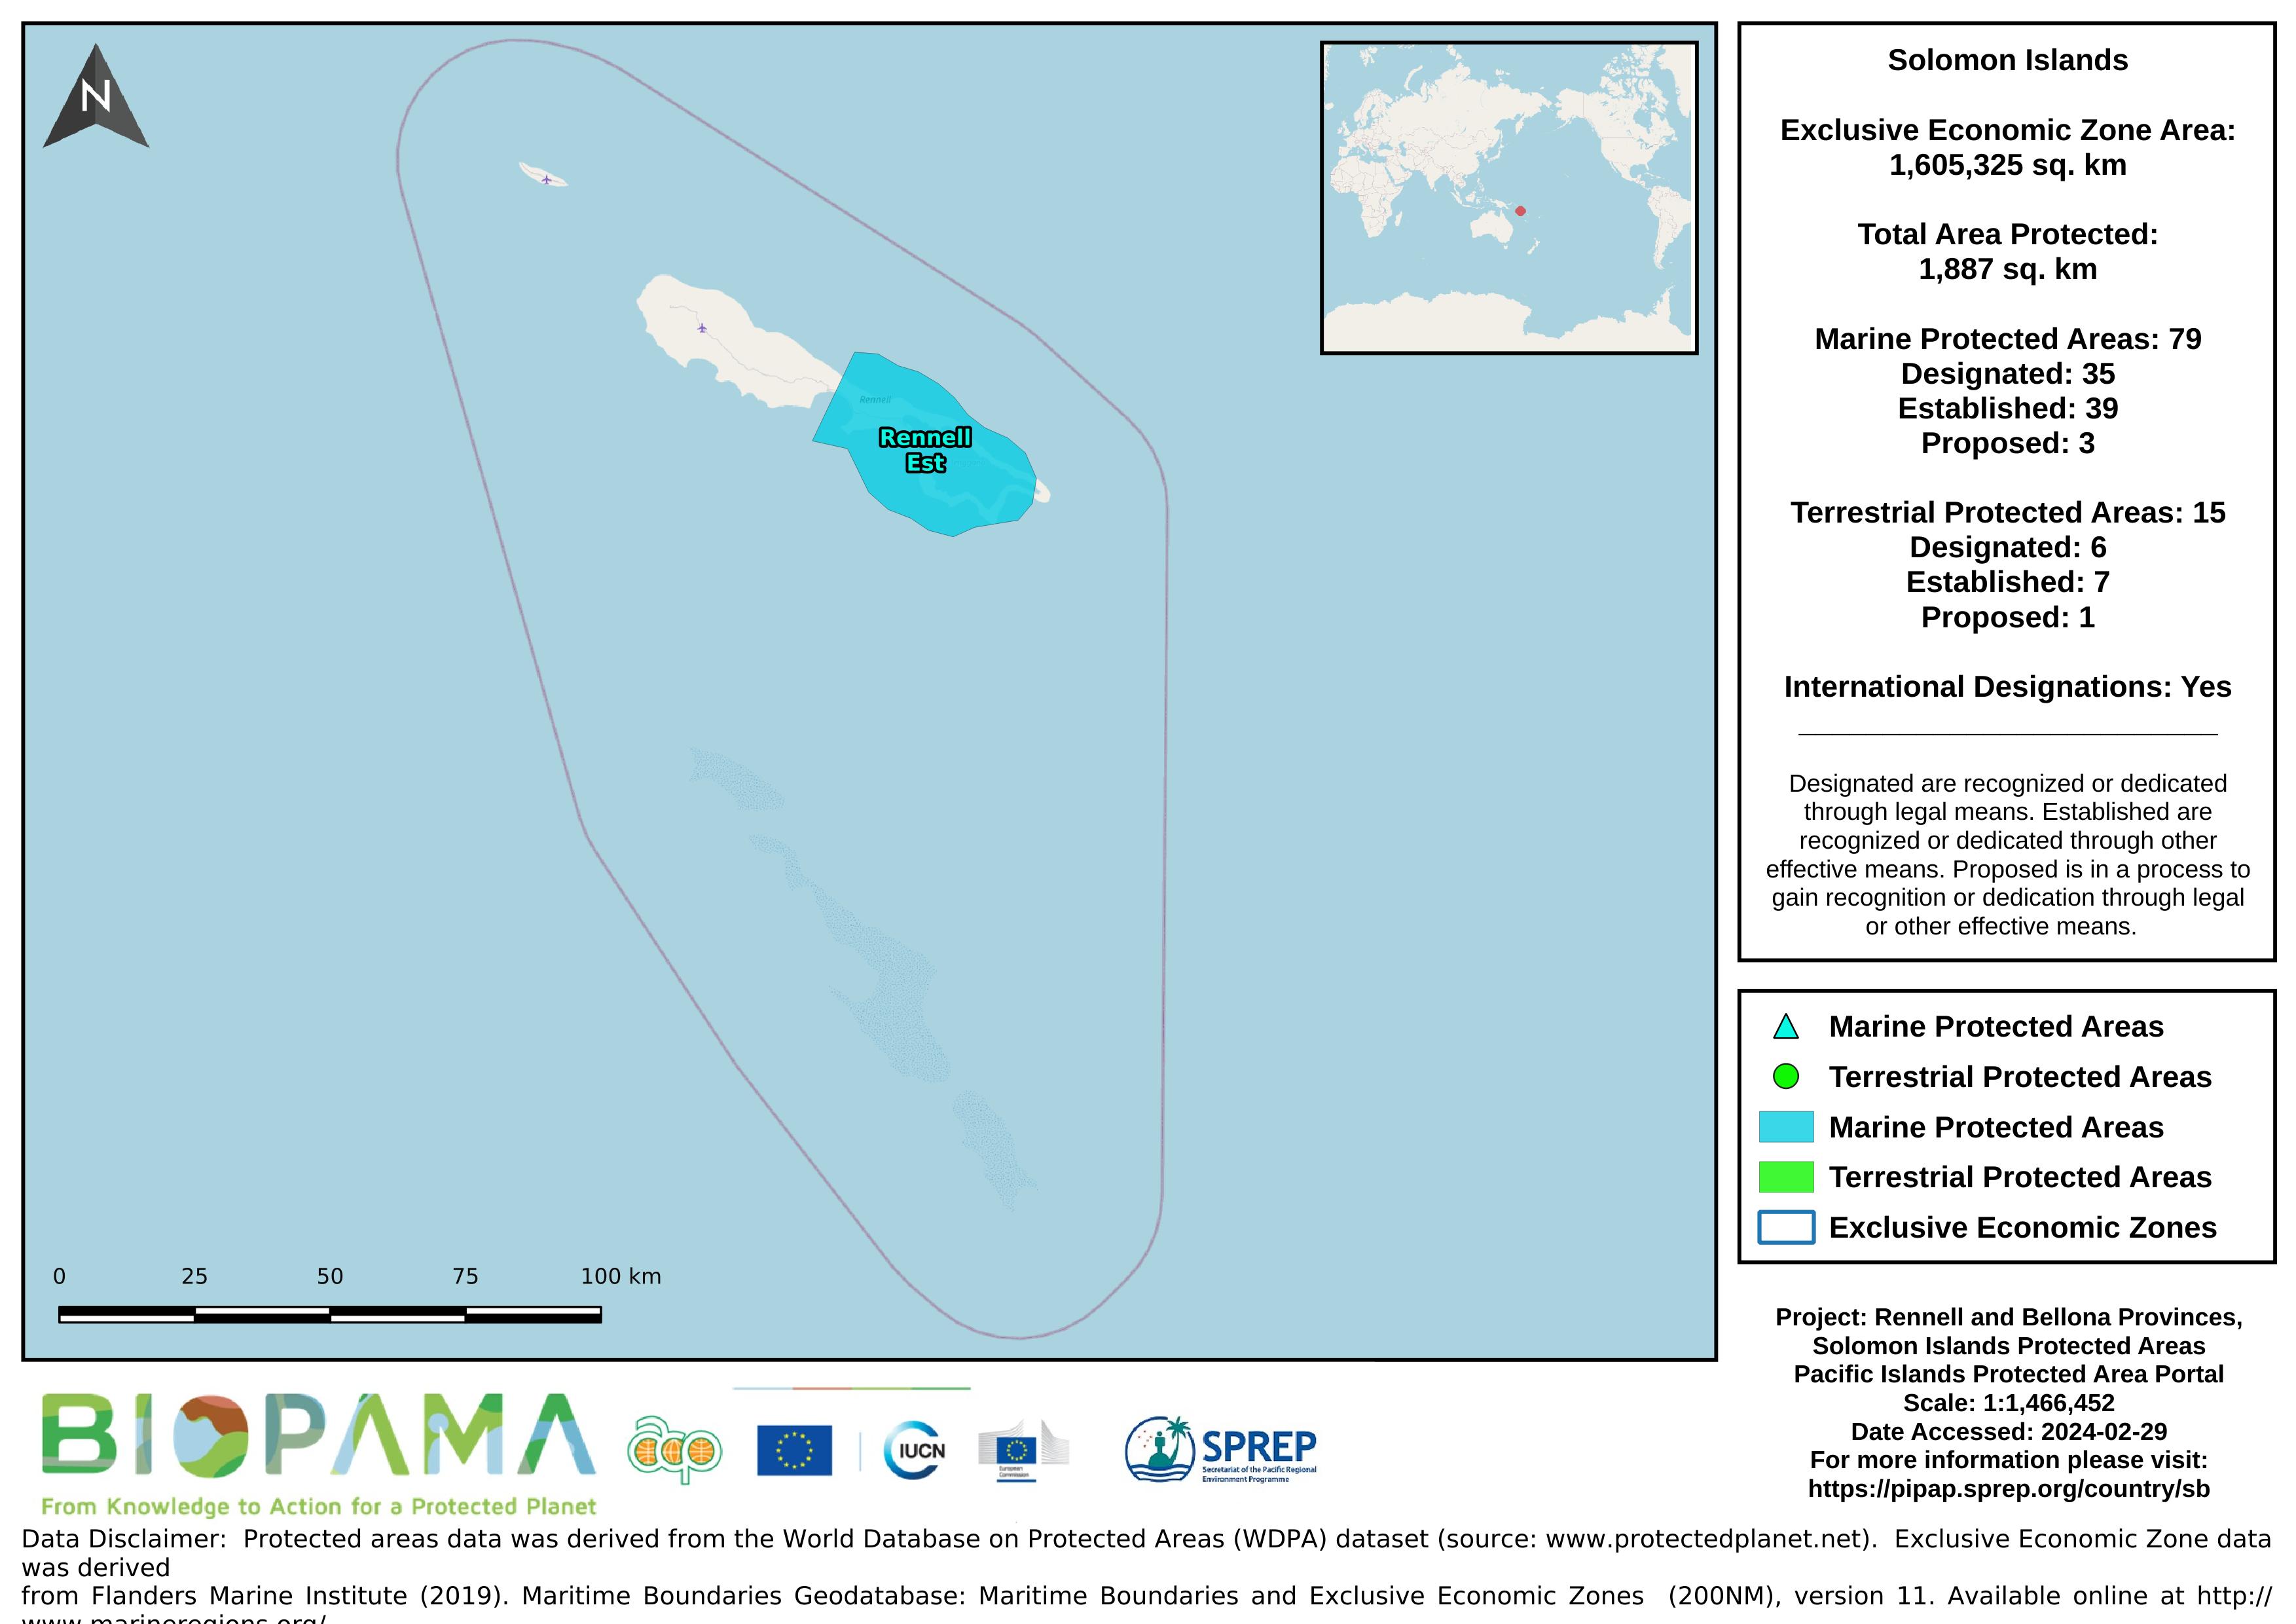
Map of the protected areas for Rennell and Bellona provinces in the Solomon Islands with country-level summary statistics on the amount of area under protection, count for each type of protected area (terrestrial or marine), and the count of their designation.
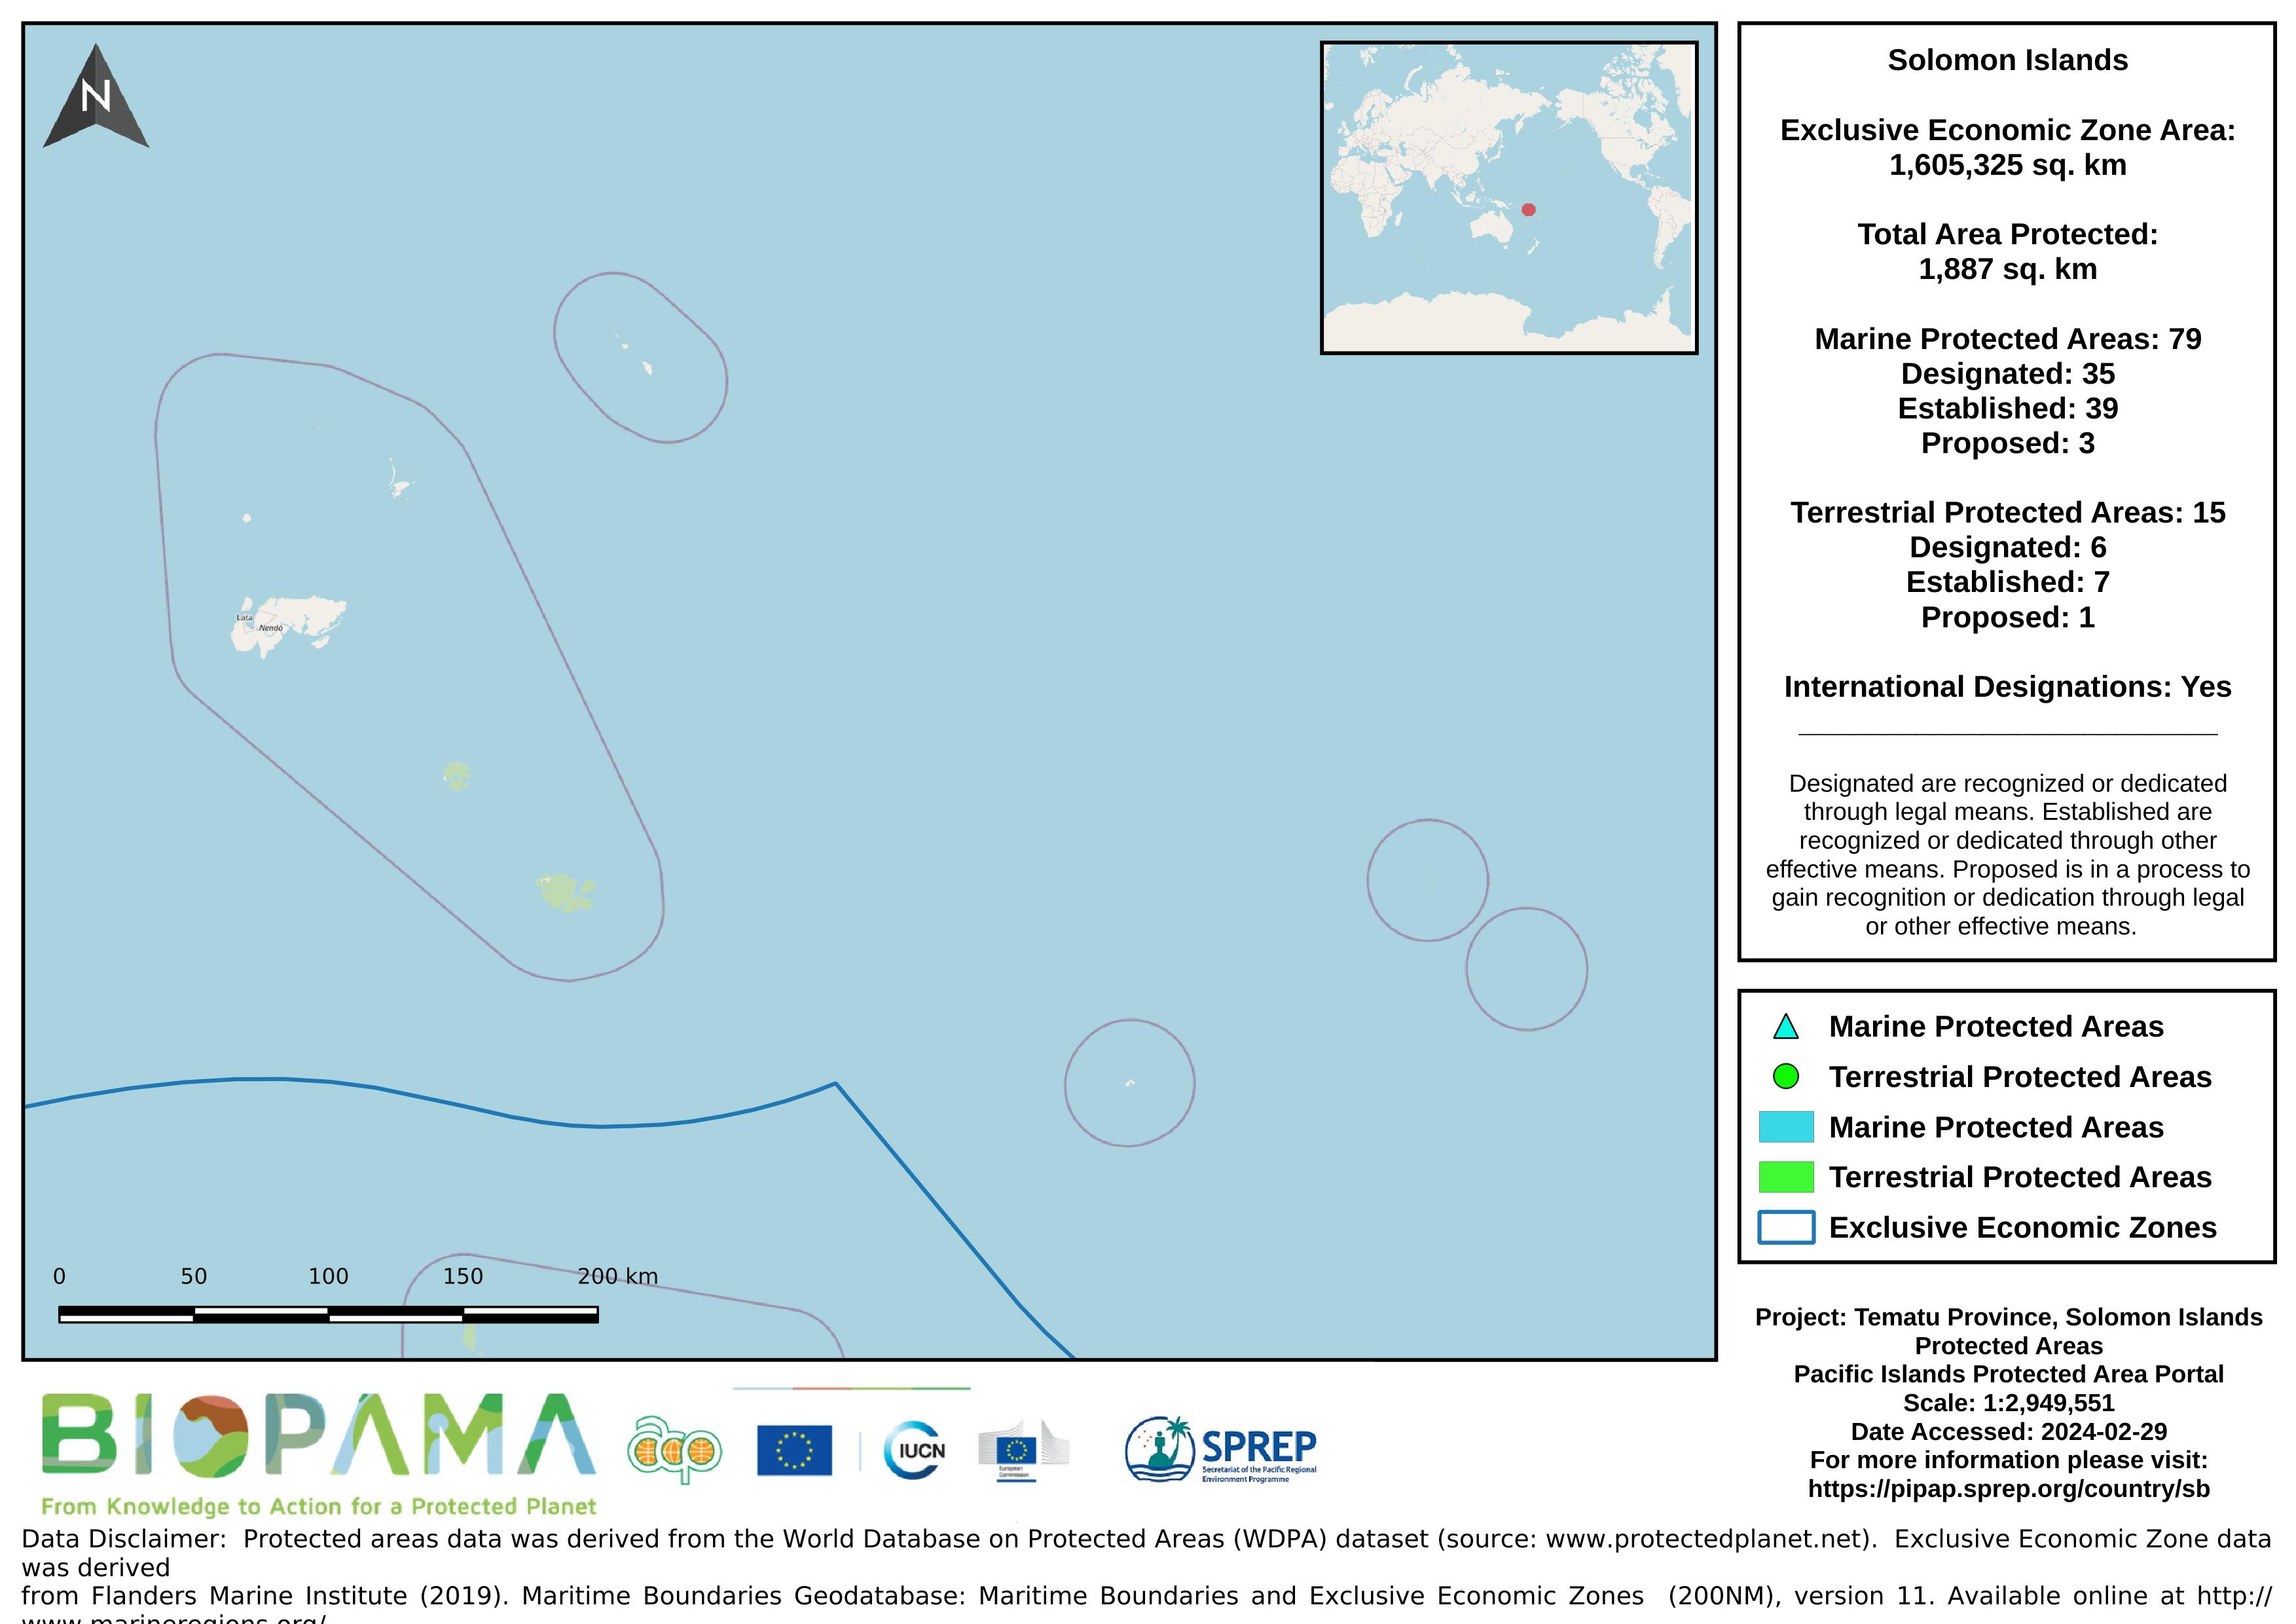
Map of the protected areas for Tematu province in the Solomon Islands with country-level summary statistics on the amount of area under protection, count for each type of protected area (terrestrial or marine), and the count of their designation.
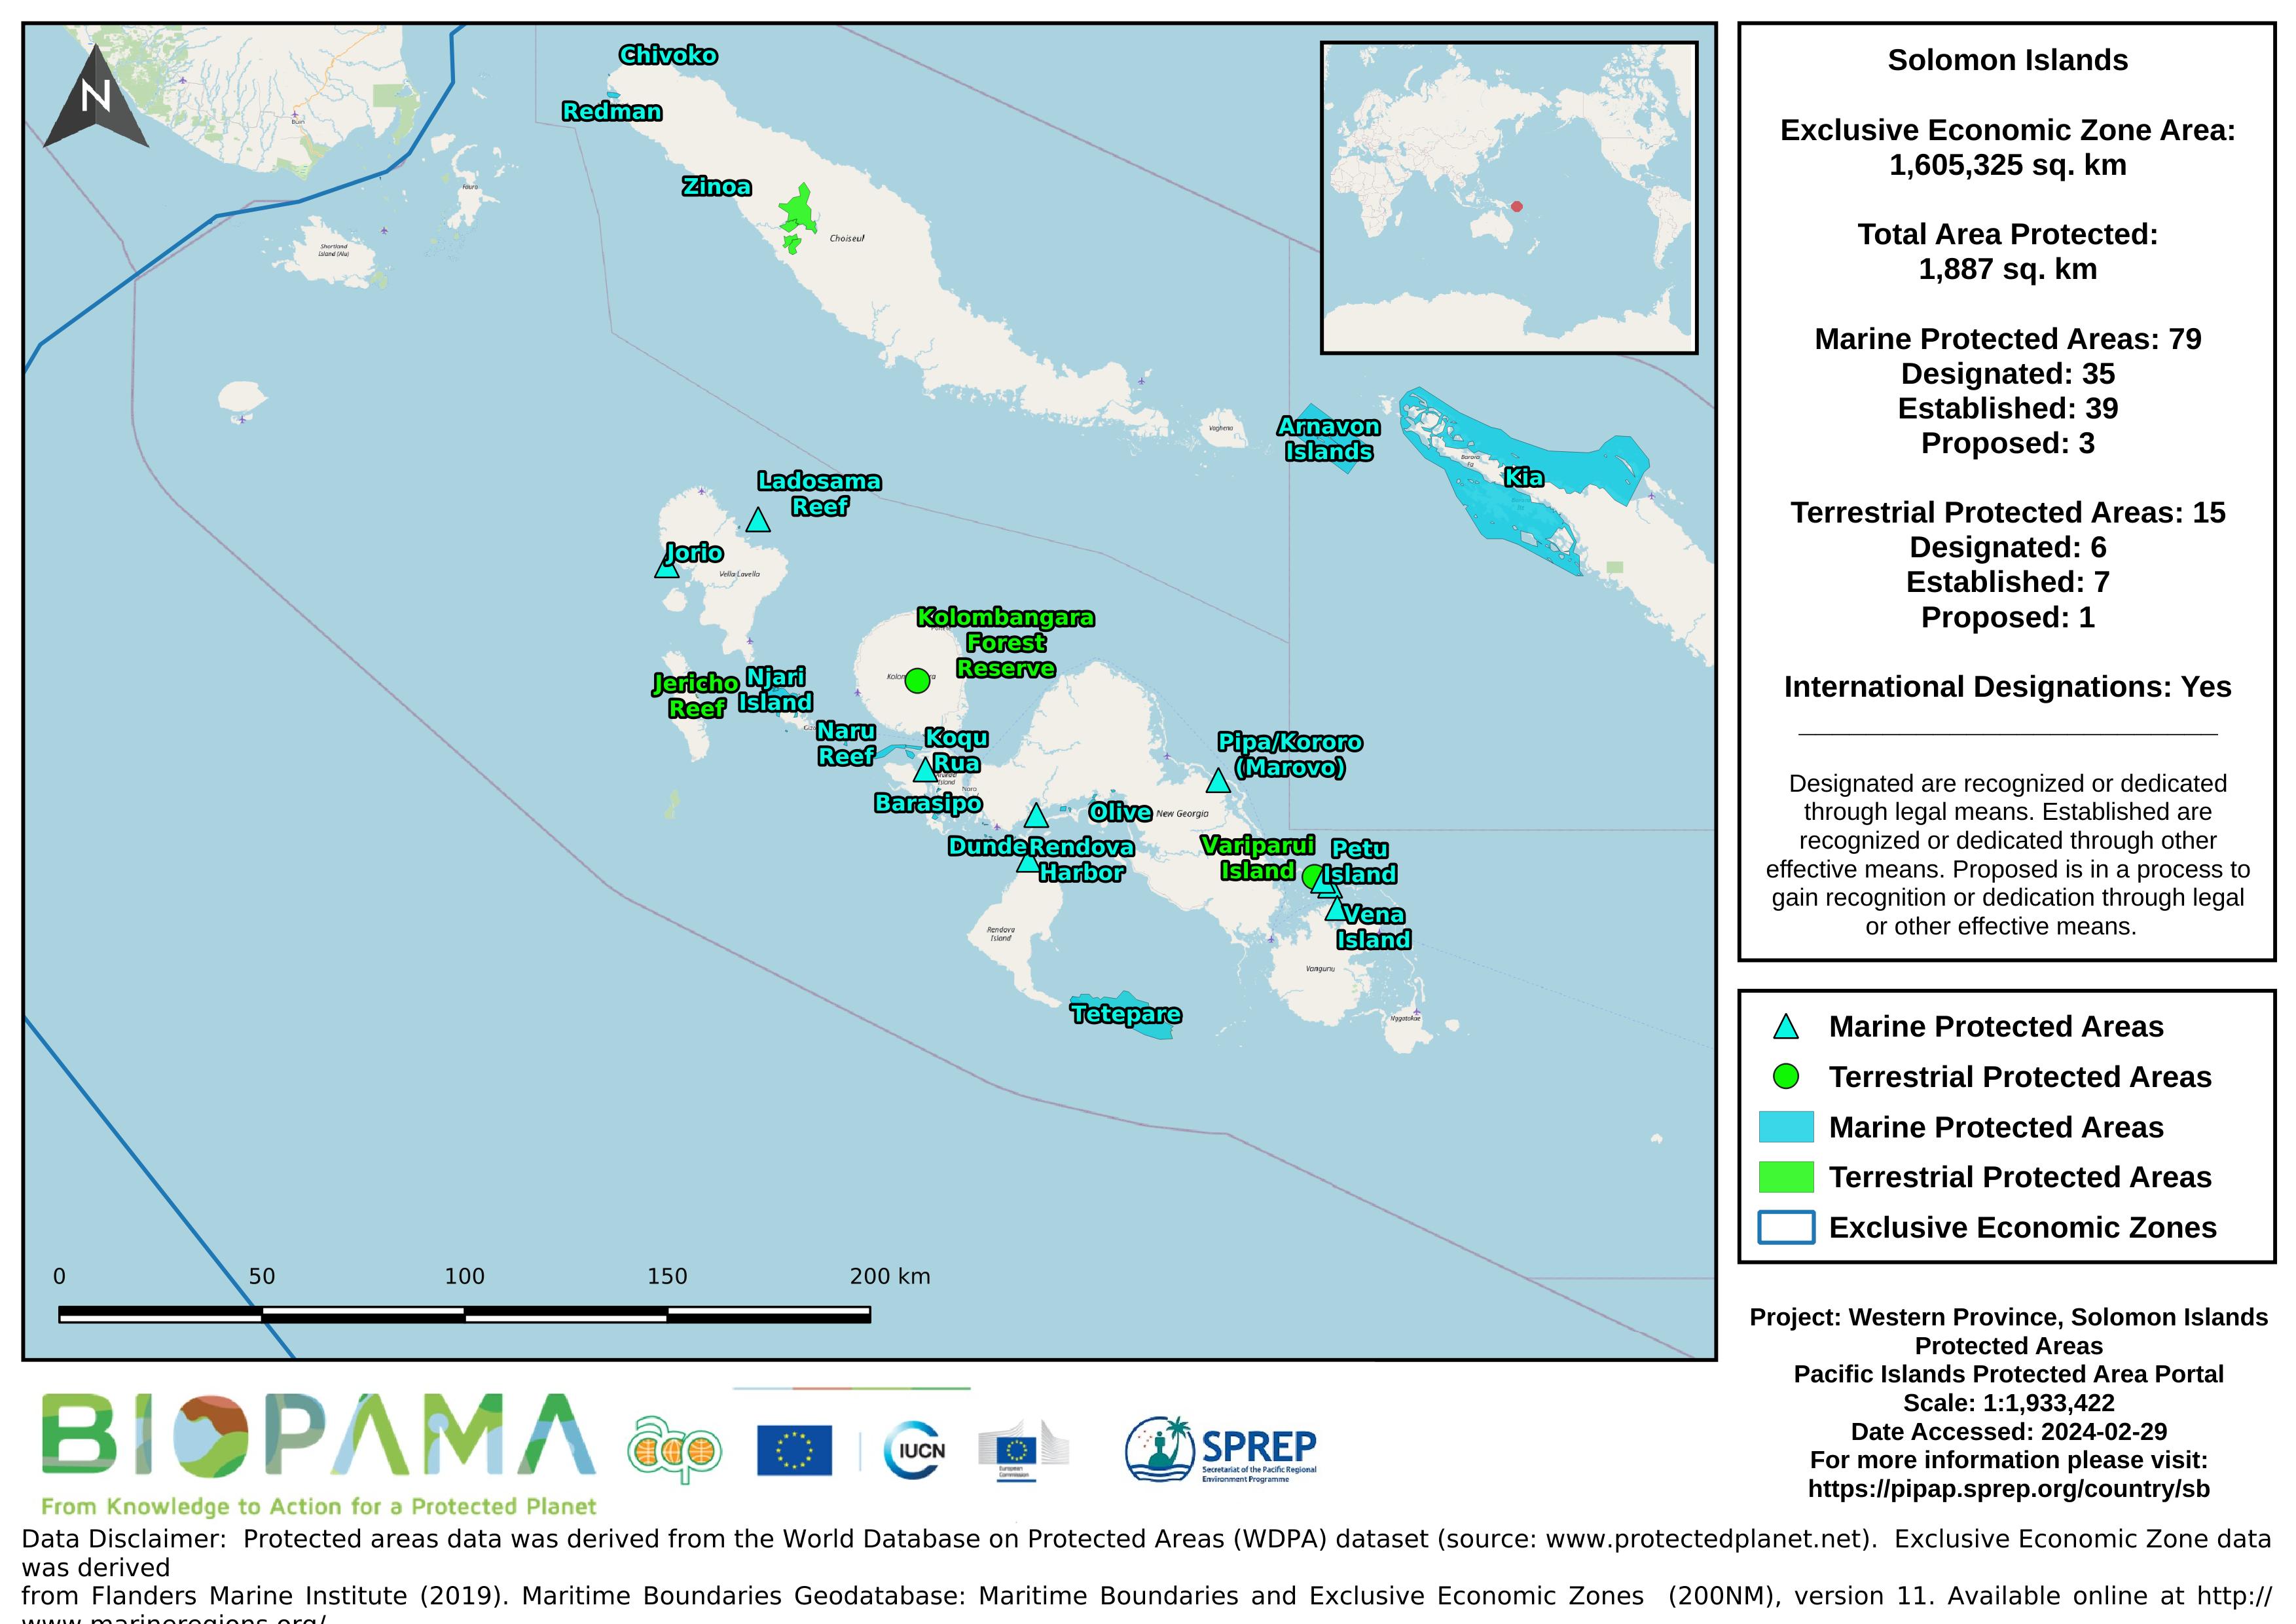
Map of the protected areas for Western province in the Solomon Islands with country-level summary statistics on the amount of area under protection, count for each type of protected area (terrestrial or marine), and the count of their designation.
The PA map of the Solomon Islands showing updated on April 22 2022
Map displaying tree cover loss with > 30% canopy density, between 2001-2018. Tree cover loss is not always deforestation. Global Forest Watch data.
This is an example map from the Solomon Islands Marine Atlas. A series of maps from the Marine Atlas are uploaded as separate datasets to this portal. Use the search box or filter by the keyword/tag "maps".
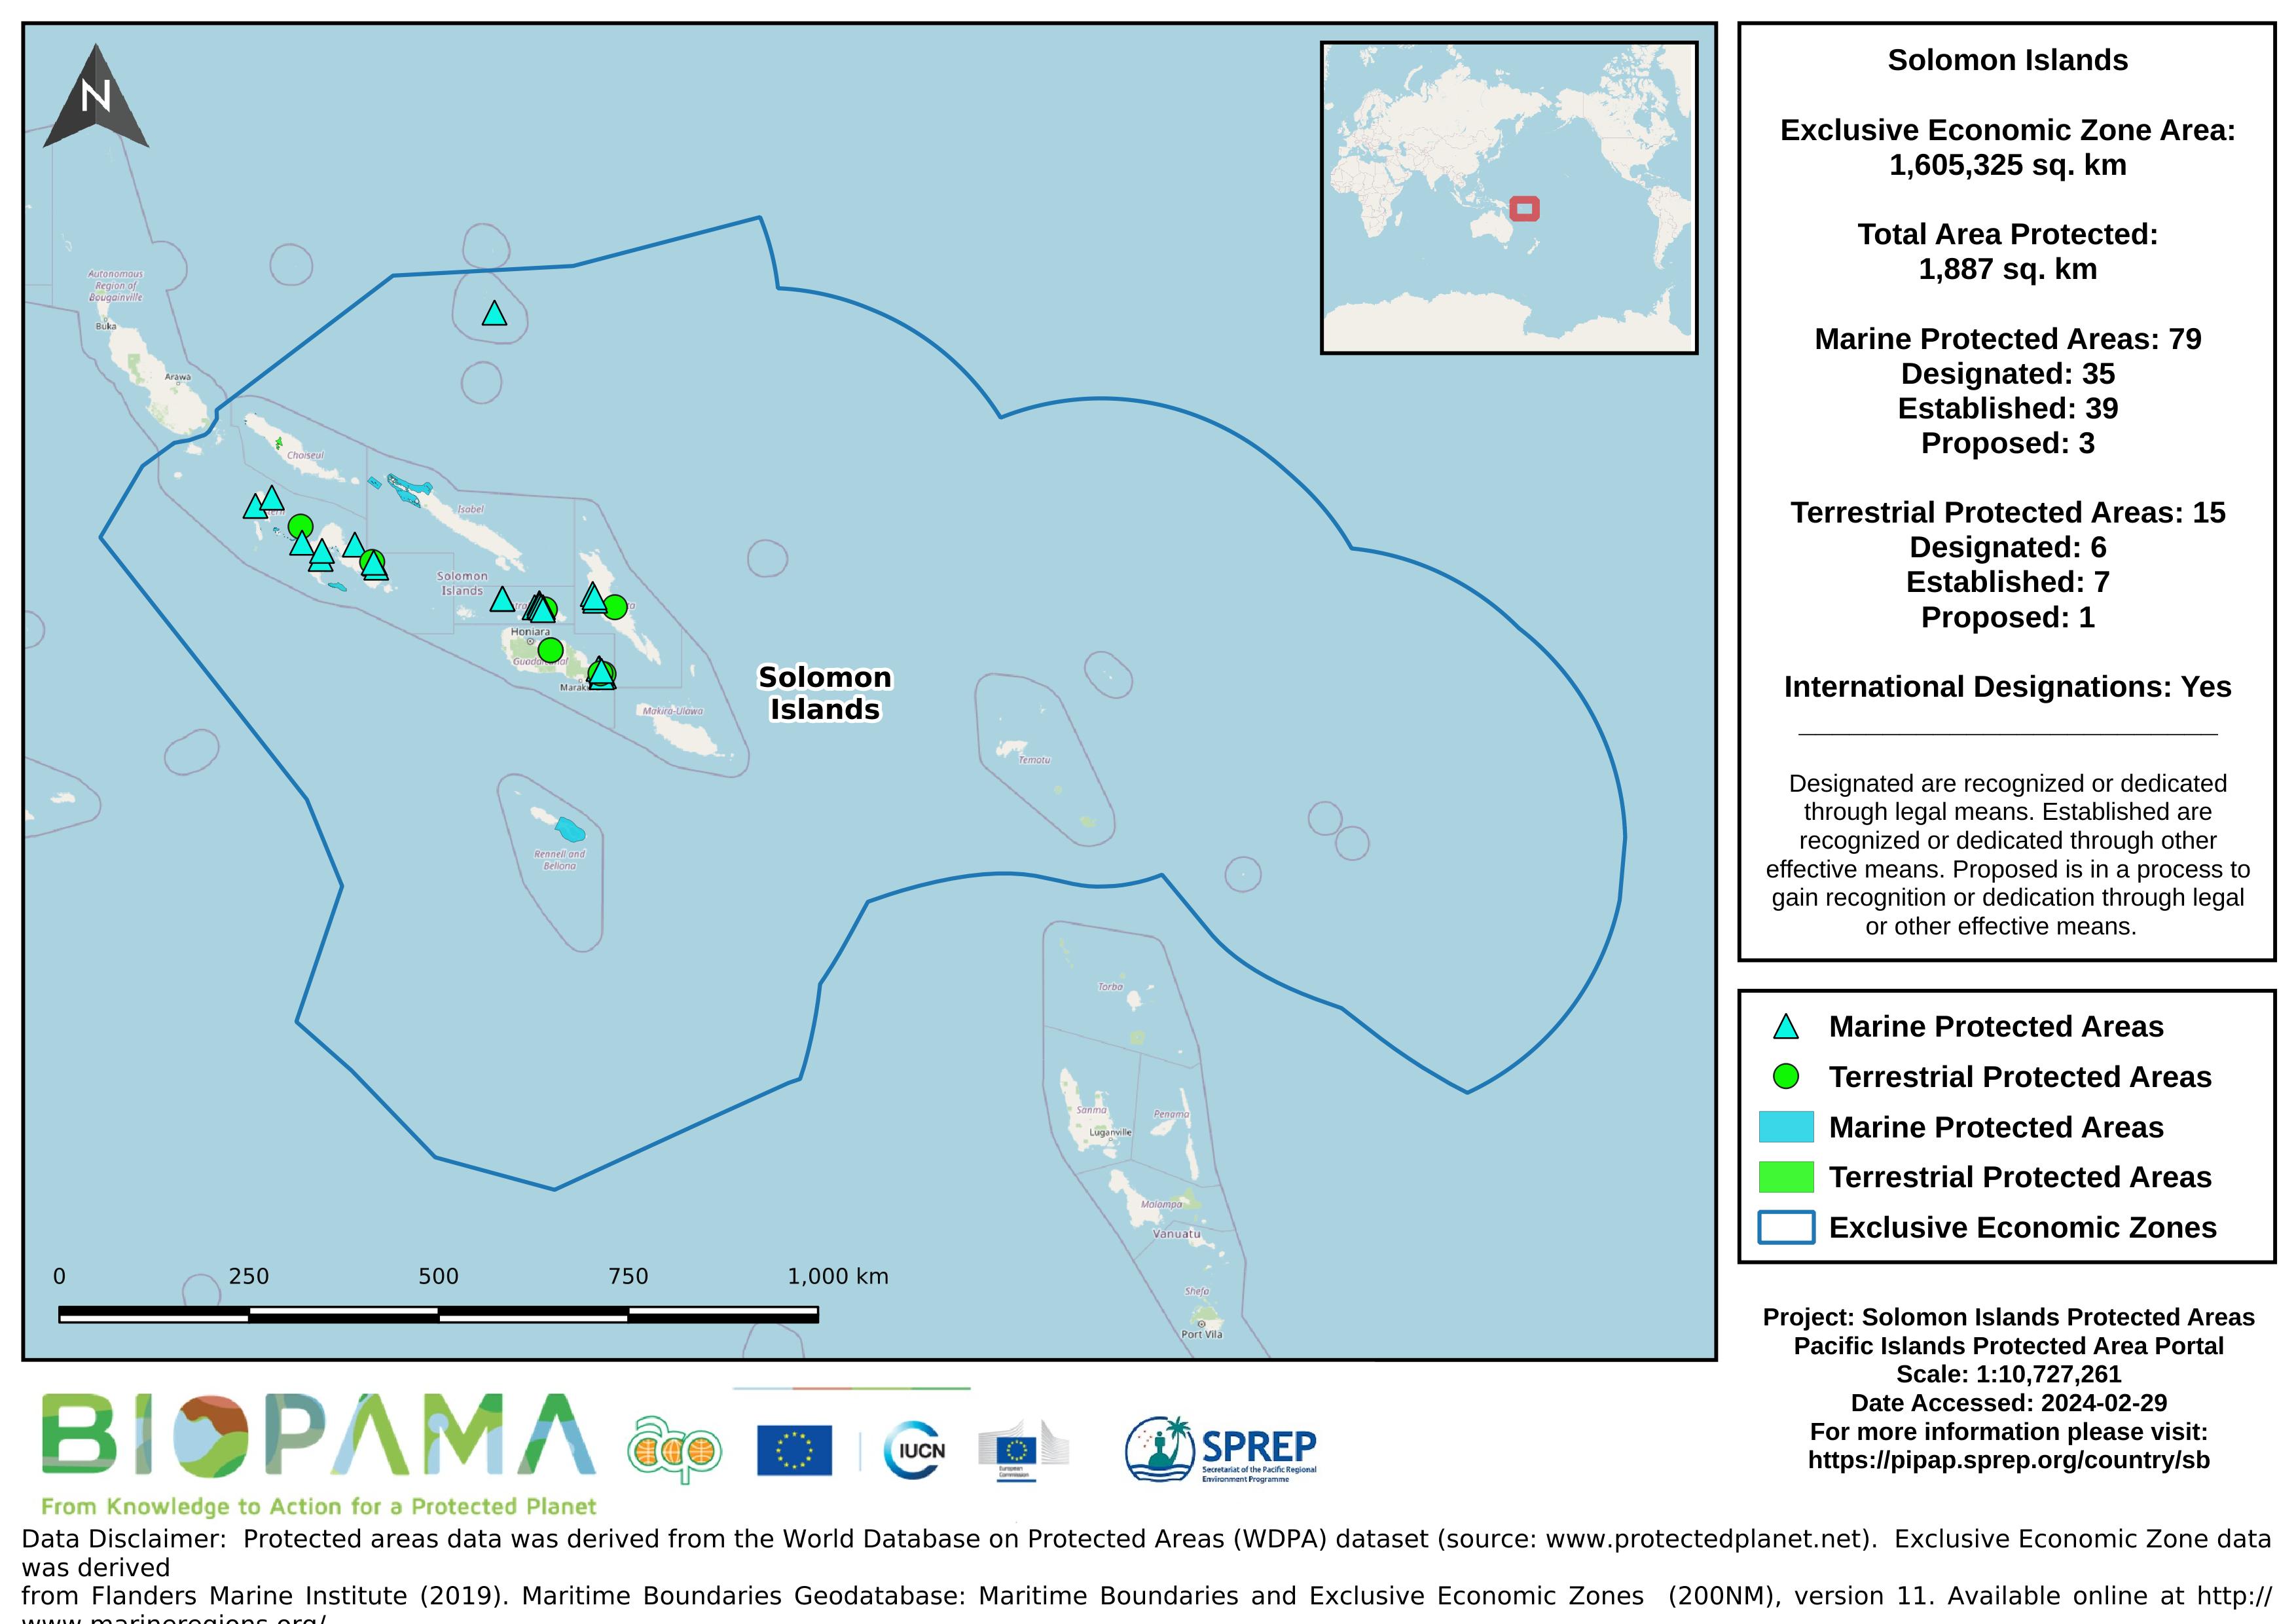
Map of the protected areas for the Solomon Islands with country-level summary statistics on the amount of area under protection, count for each type of protected area (terrestrial or marine), and the count of their designation.
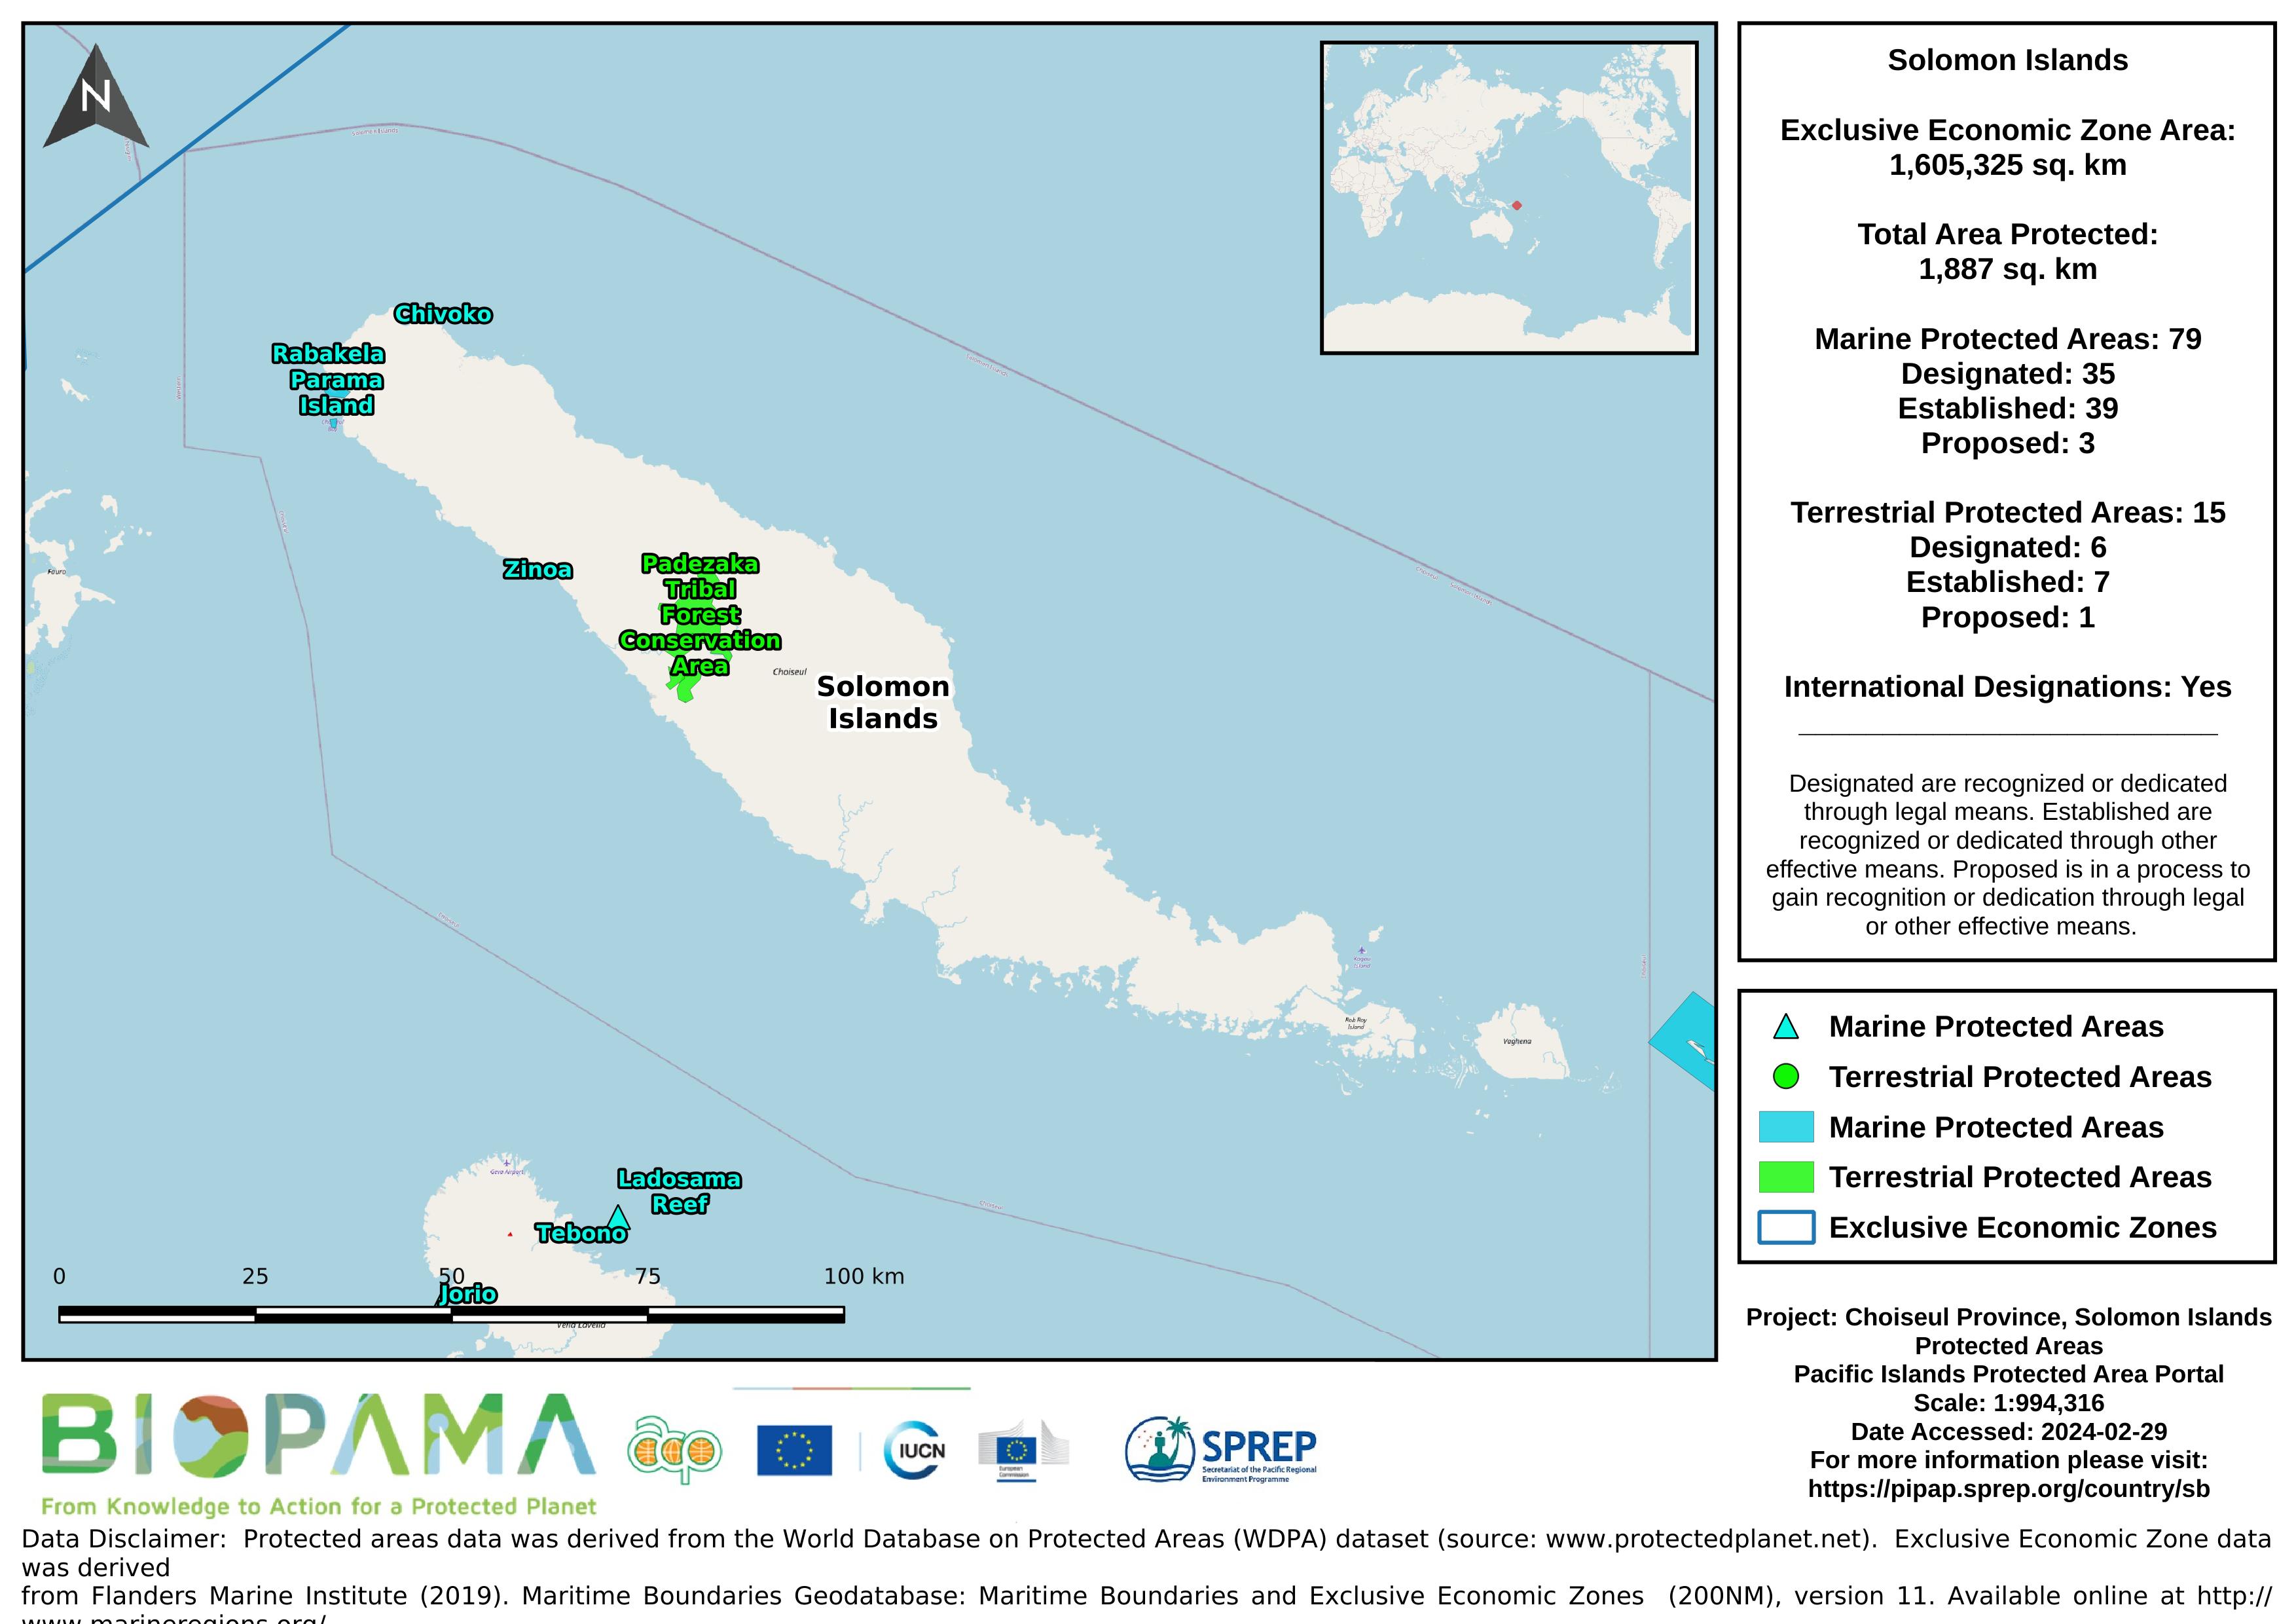
Map of the protected areas for Choiseul province in the Solomon Islands with country-level summary statistics on the amount of area under protection, count for each type of protected area (terrestrial or marine), and the count of their designation.
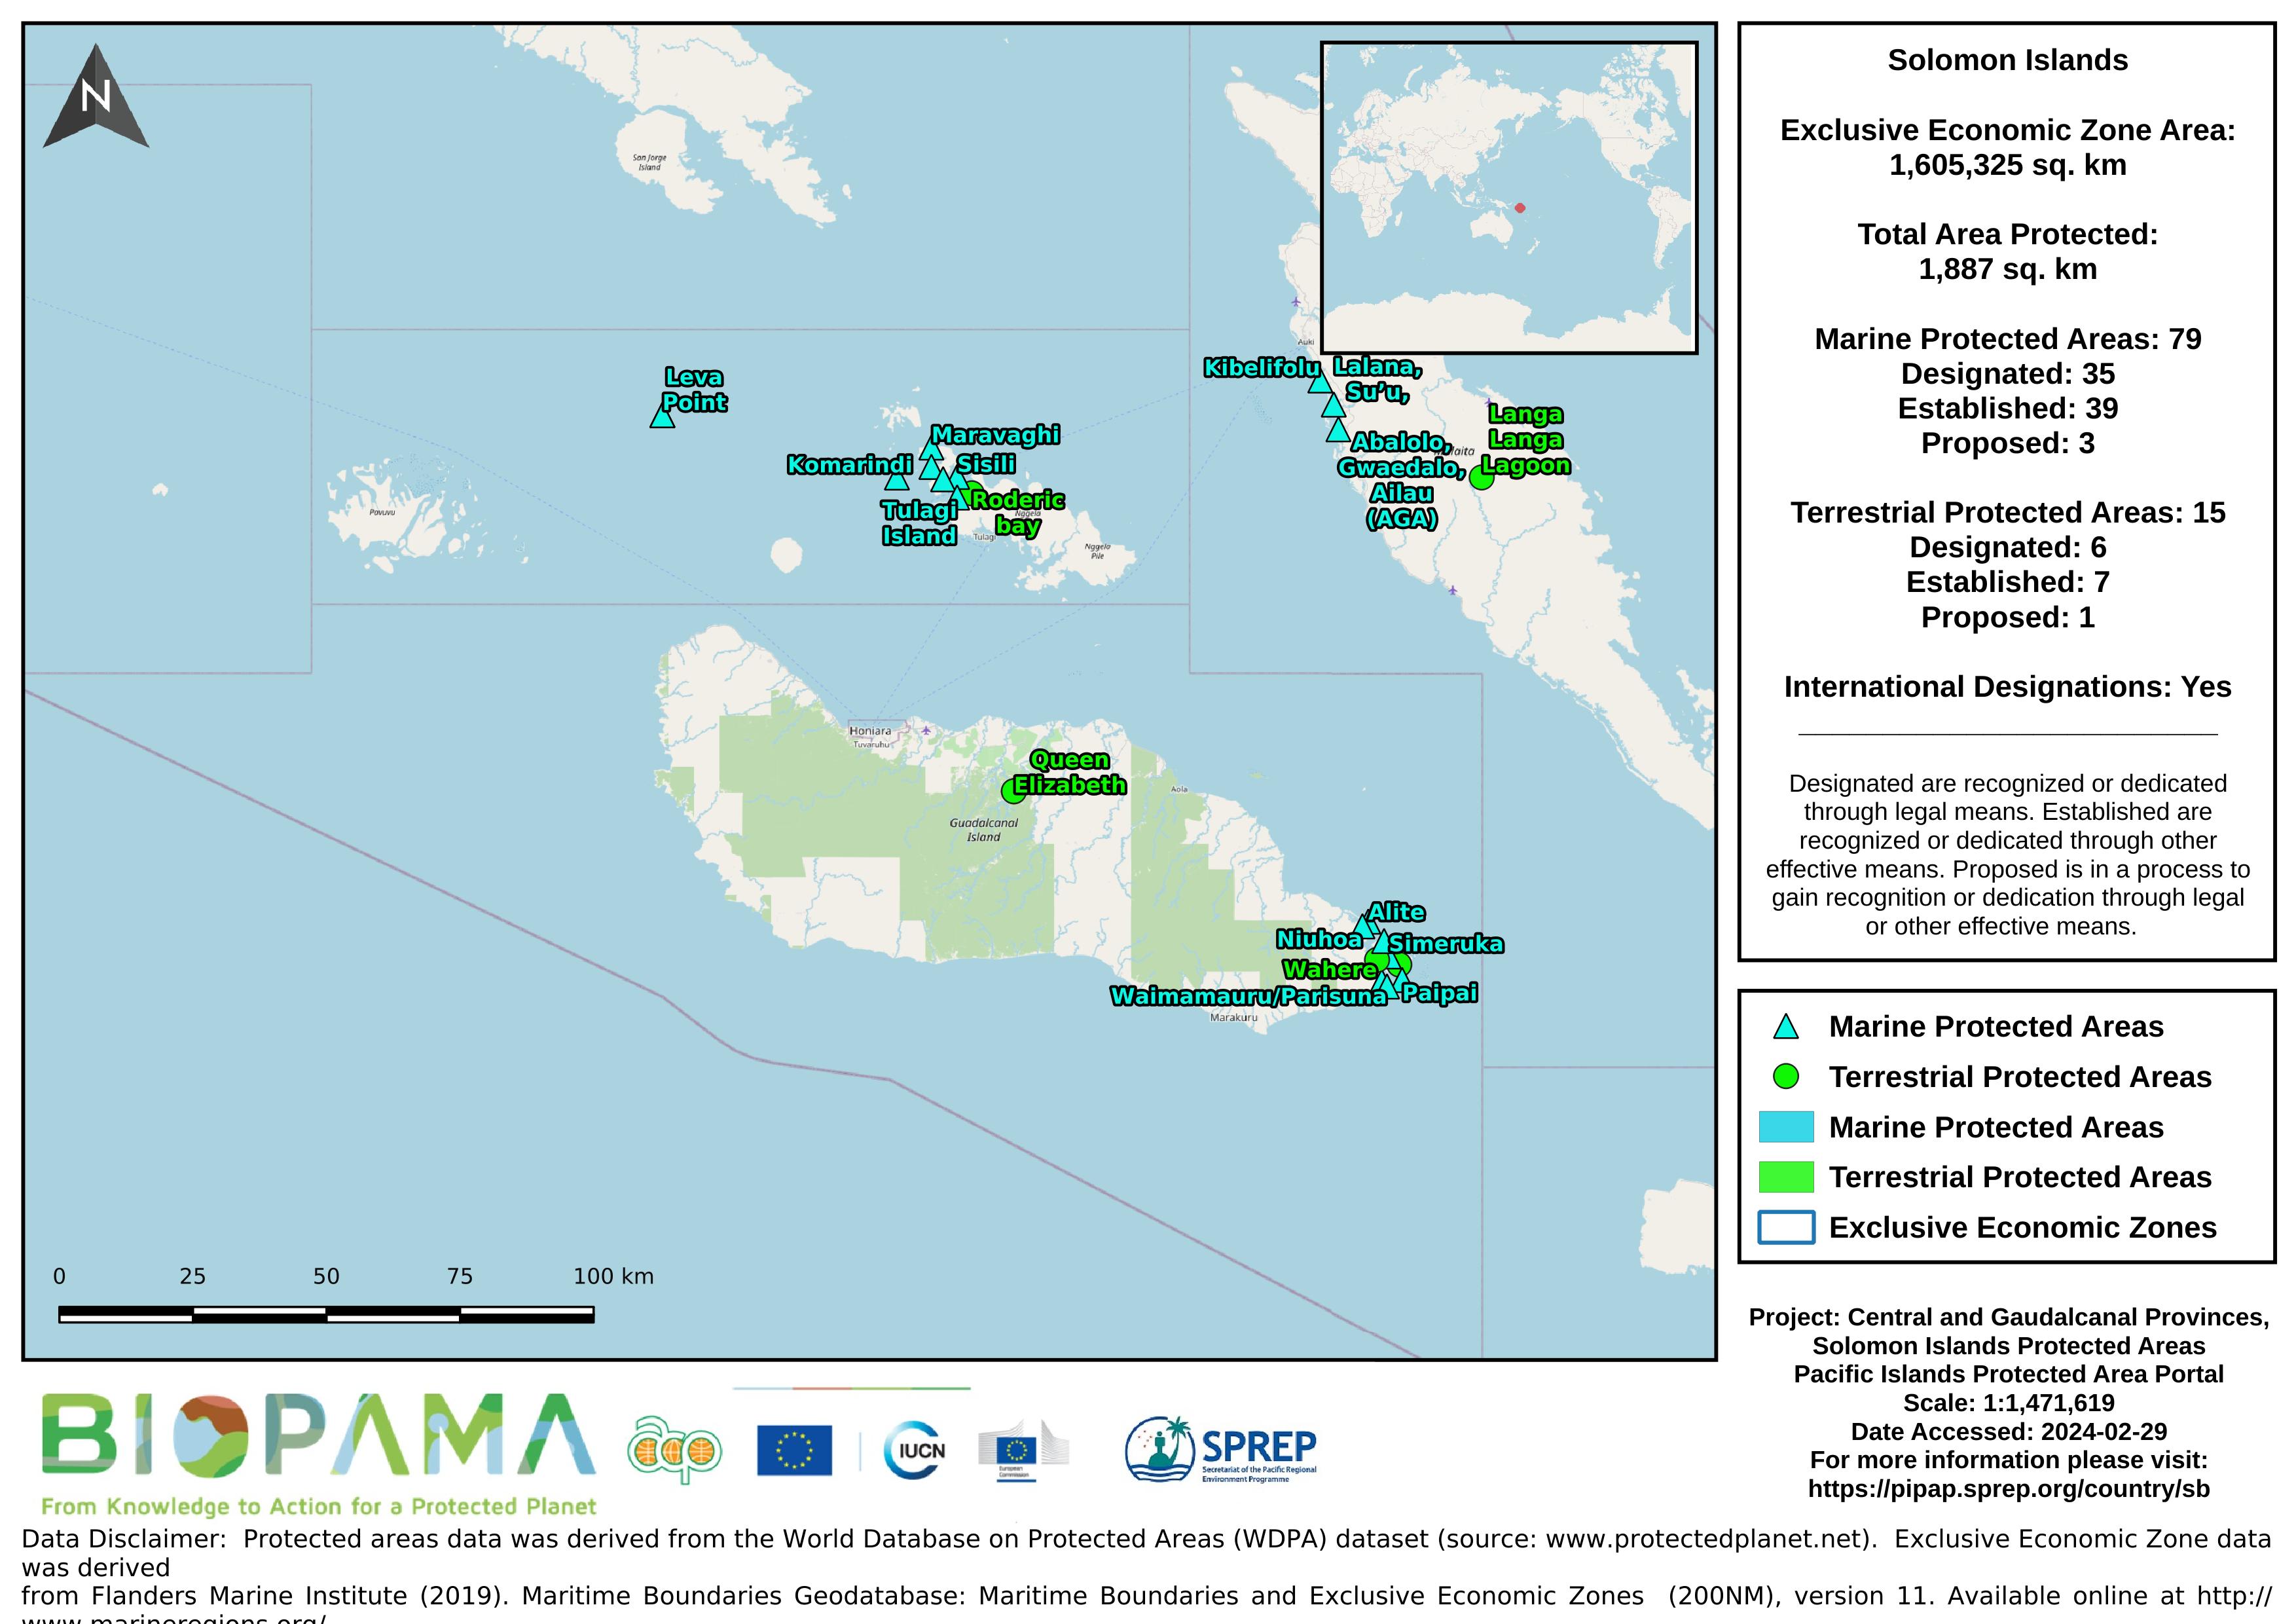
Map of the protected areas for Guadalcanal and Central provinces in the Solomon Islands with country-level summary statistics on the amount of area under protection, count for each type of protected area (terrestrial or marine), and the count of their designation.
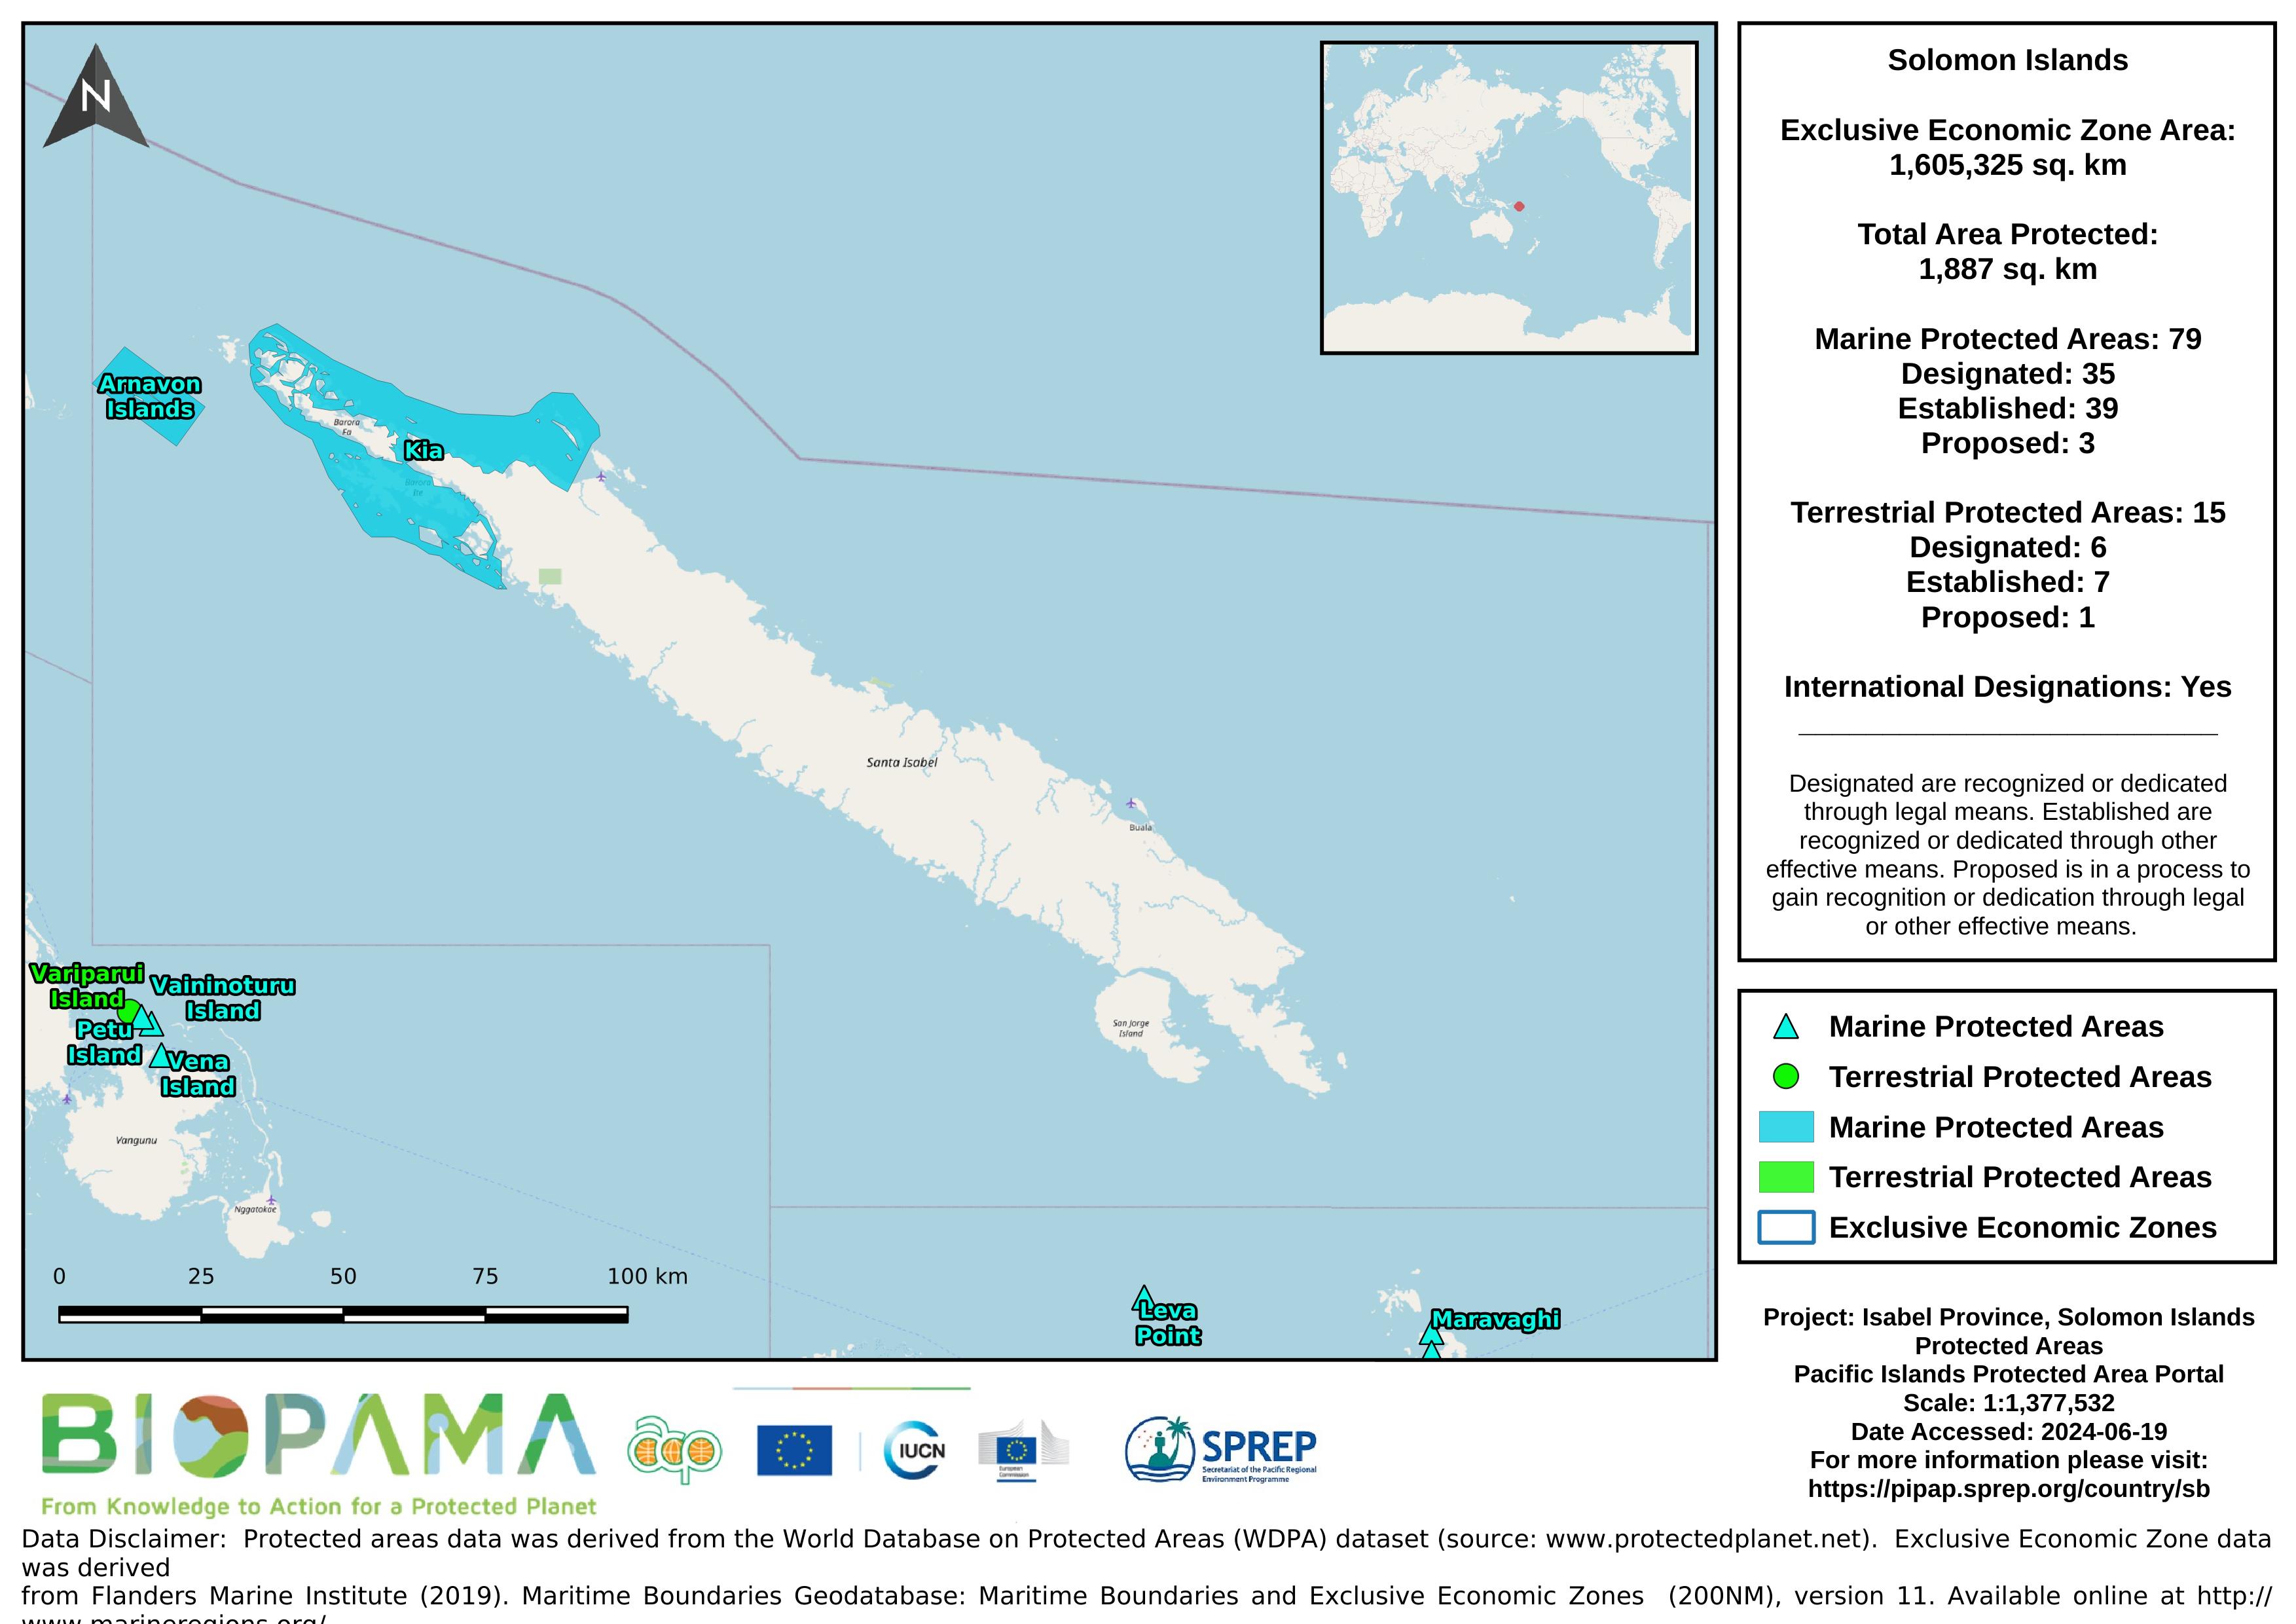
Map of the protected areas for Isabel province in the Solomon Islands with country-level summary statistics on the amount of area under protection, count for each type of protected area (terrestrial or marine), and the count of their designation.
Map of the protected areas for Makira-Ulawa province in the Solomon Islands with country-level summary statistics on the amount of area under protection, count for each type of protected area (terrestrial or marine), and the count of their designation.
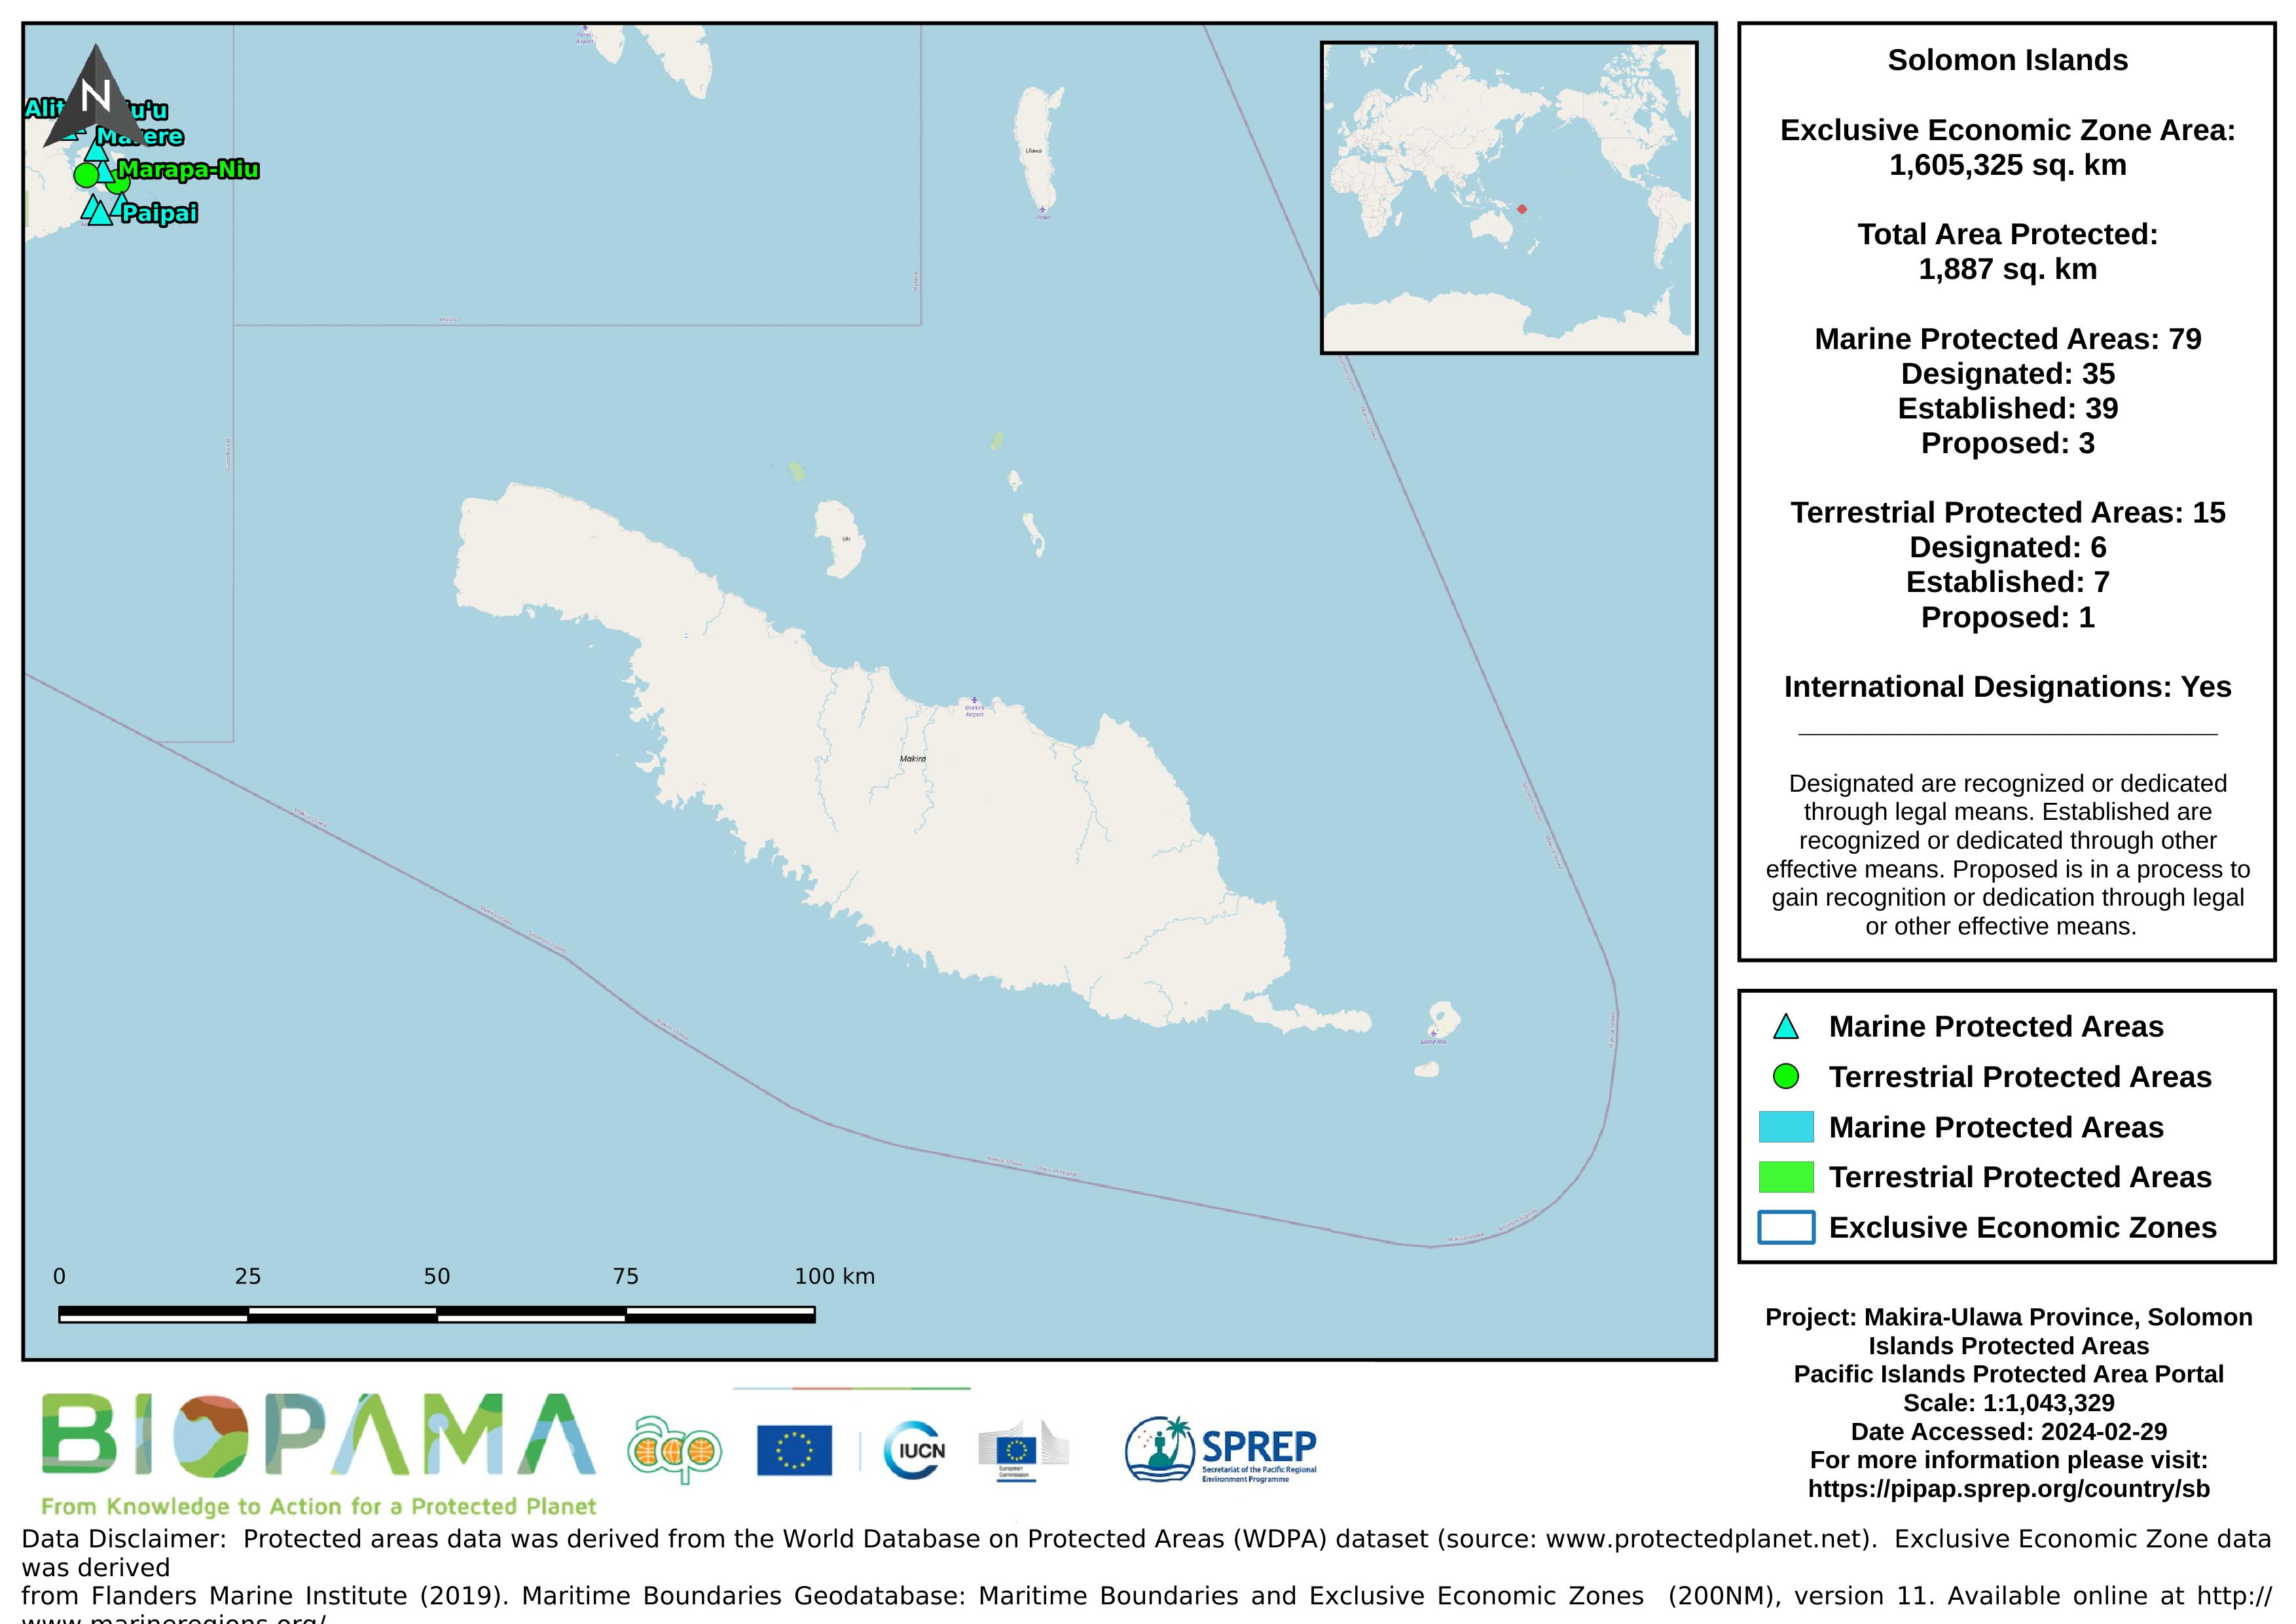
GEBCO’s gridded bathymetric data set, the GEBCO_2020 grid, is a global terrain model for ocean and land at 15 arc-second intervals. It is accompanied by a Type Identifier (TID) Grid that gives information on the types of source data that the GEBCO_2020 Grid is based.
If the data sets are used in a presentation or publication then we ask that you acknowledge the source.This should be of the form: GEBCO Compilation Group (2020) GEBCO 2020 Grid (doi:10.5285/a29c5465-b138-234d-e053-6c86abc040b9)
Raster data representing the mean levels of chlorophyll in mg/m3 for the surface water layer. The data are available for global-scale applications at a spatial resolution of 5 arcmin (approximately 9.2 km at the equator).
Marine data layers for present conditions were produced with climate data describing monthly averages for the period 2000–2014, obtained from pre-processed global ocean re-analyses combining satellite and in situ observations at regular two- and three-dimensional spatial grids.