Bioenergy occupies a unique position at the nexus of energy, environment, climate change and rural development agendas. Consequently, bioenergy and biofuels in particular, have seen
record levels of support in the form of subsidies, mandates and investments as governments seek to maximize the perceived synergies between the various opportunities offered by bioenergy. Whilst it is true that well- planned bioenergy development can reduce greenhouse gas emissions from a range of sources, increase rural incomes, reduce waste, improve access
This zipped file contains pdf documents on the First Workshop on Planning Framework for HCC SWM Plan in January 2018.
FAO Agriculture and Fair Trade in Pacific Island Countries. This desk study has been prepared by Winnie Fay Bell and comments were kindly provided by the Pacific Regional Organic Task Force in May 2009
The PA map of the Solomon Islands showing updated on April 22 2022
Poster developed by MACBIO summarizing lessons learned in locally managed marine protected area ACMCA. Language Pijin (coming soon)
spatial dataset with revised deepwater bioregions (Source: MACBIO)
spatial dataset with revised reef associated bioregions (Source: MACBIO)
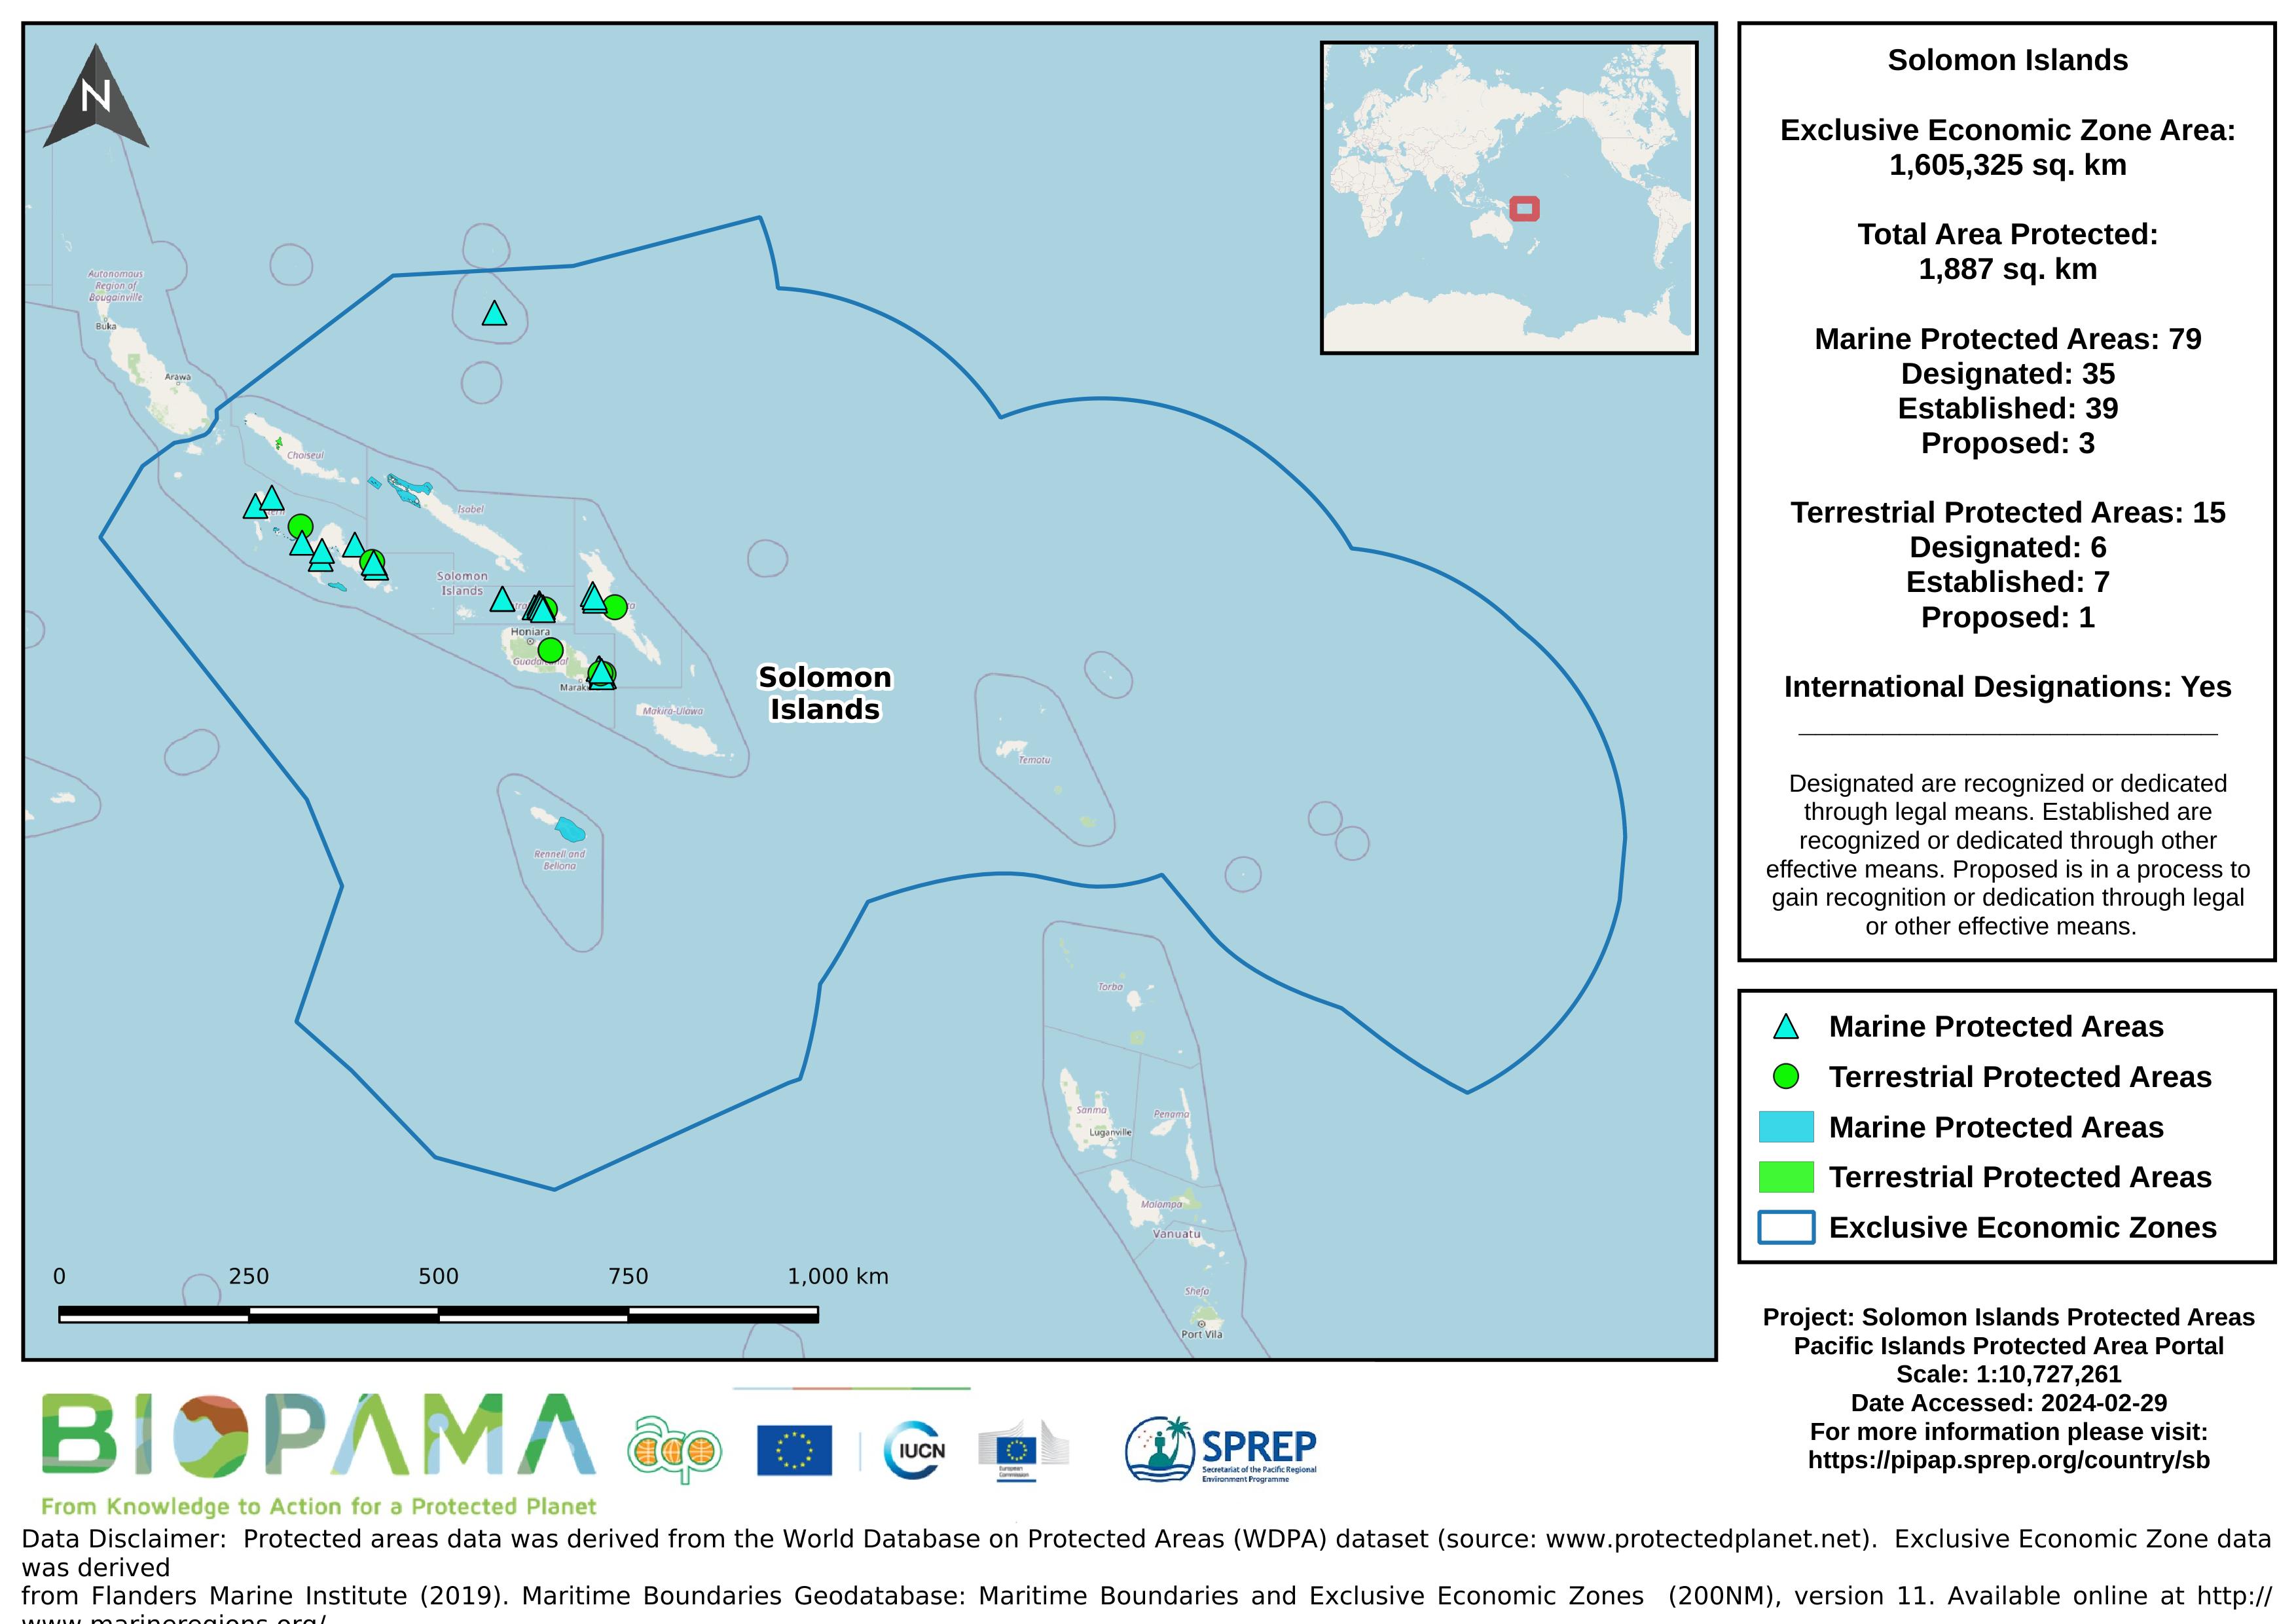
Map of the protected areas for the Solomon Islands with country-level summary statistics on the amount of area under protection, count for each type of protected area (terrestrial or marine), and the count of their designation.
Map of the protected areas for the Solomon Islands with country-level summary statistics on the amount of area under protection, count for each type of protected area (terrestrial or marine), and the count of their designation.
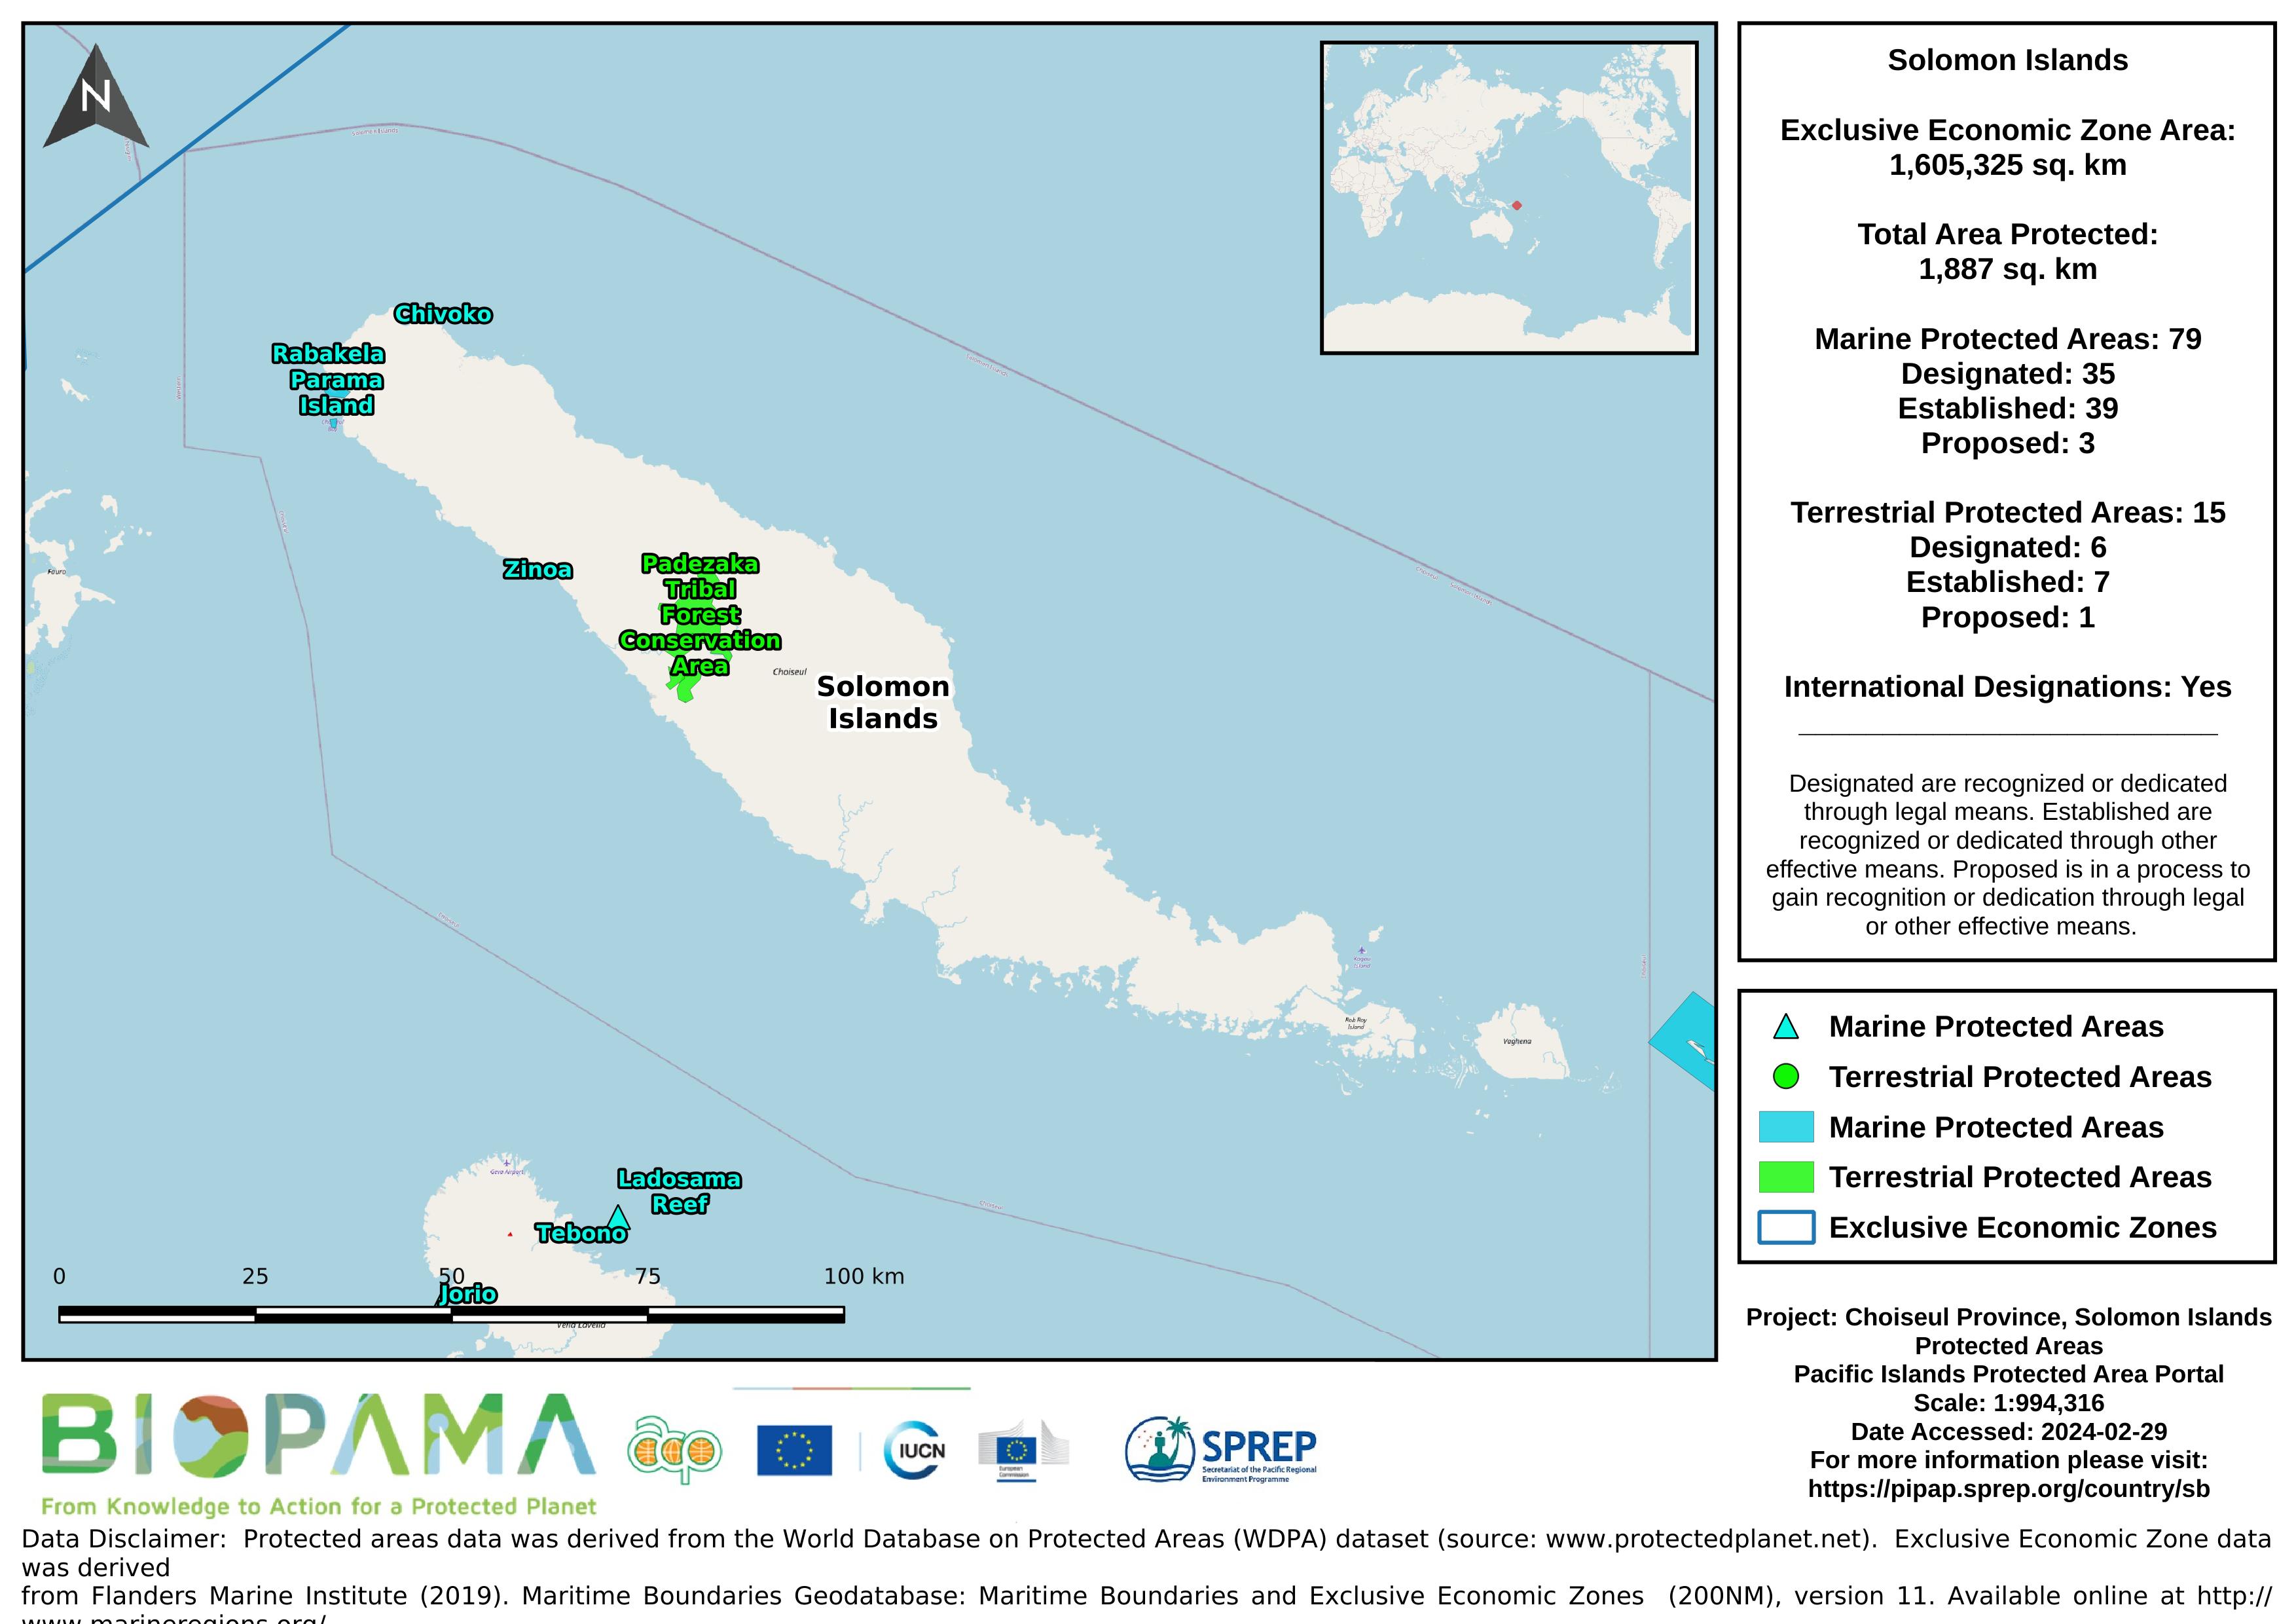
Map of the protected areas for Choiseul province in the Solomon Islands with country-level summary statistics on the amount of area under protection, count for each type of protected area (terrestrial or marine), and the count of their designation.
Map of the protected areas for Choiseul province in the Solomon Islands with country-level summary statistics on the amount of area under protection, count for each type of protected area (terrestrial or marine), and the count of their designation.
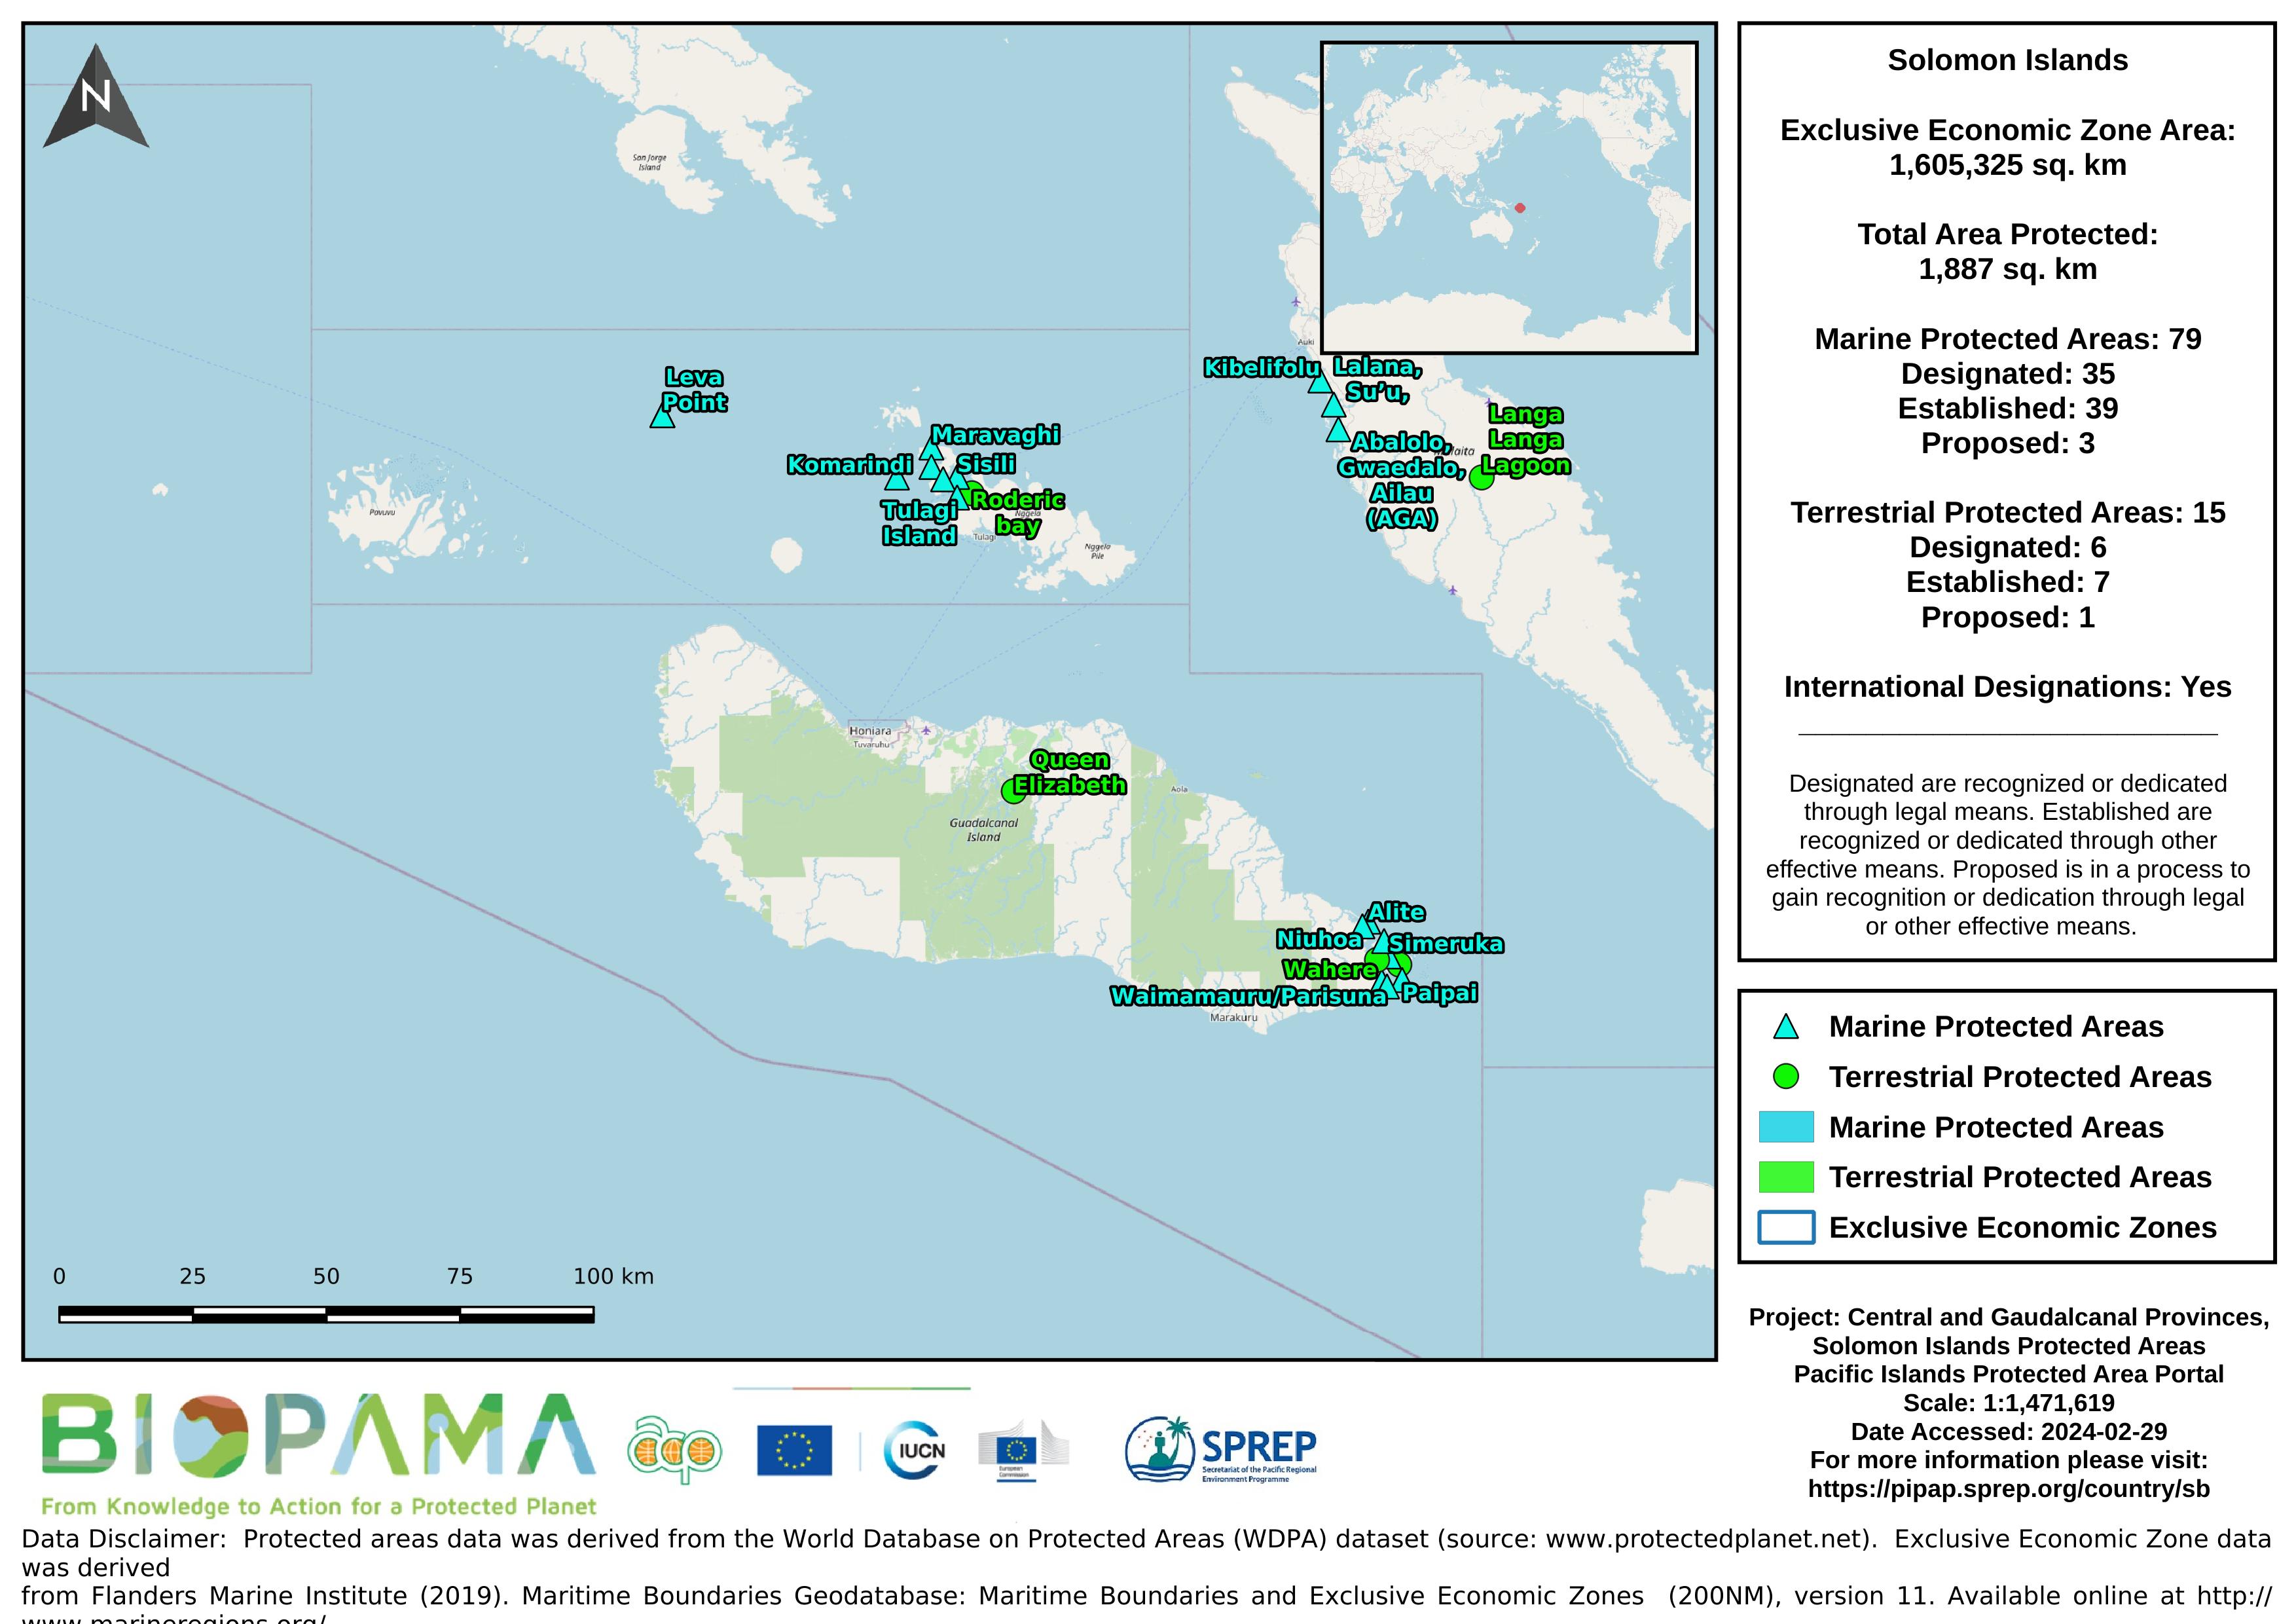
Map of the protected areas for Guadalcanal and Central provinces in the Solomon Islands with country-level summary statistics on the amount of area under protection, count for each type of protected area (terrestrial or marine), and the count of their designation.
Map of the protected areas for Guadalcanal and Central provinces in the Solomon Islands with country-level summary statistics on the amount of area under protection, count for each type of protected area (terrestrial or marine), and the count of their designation.
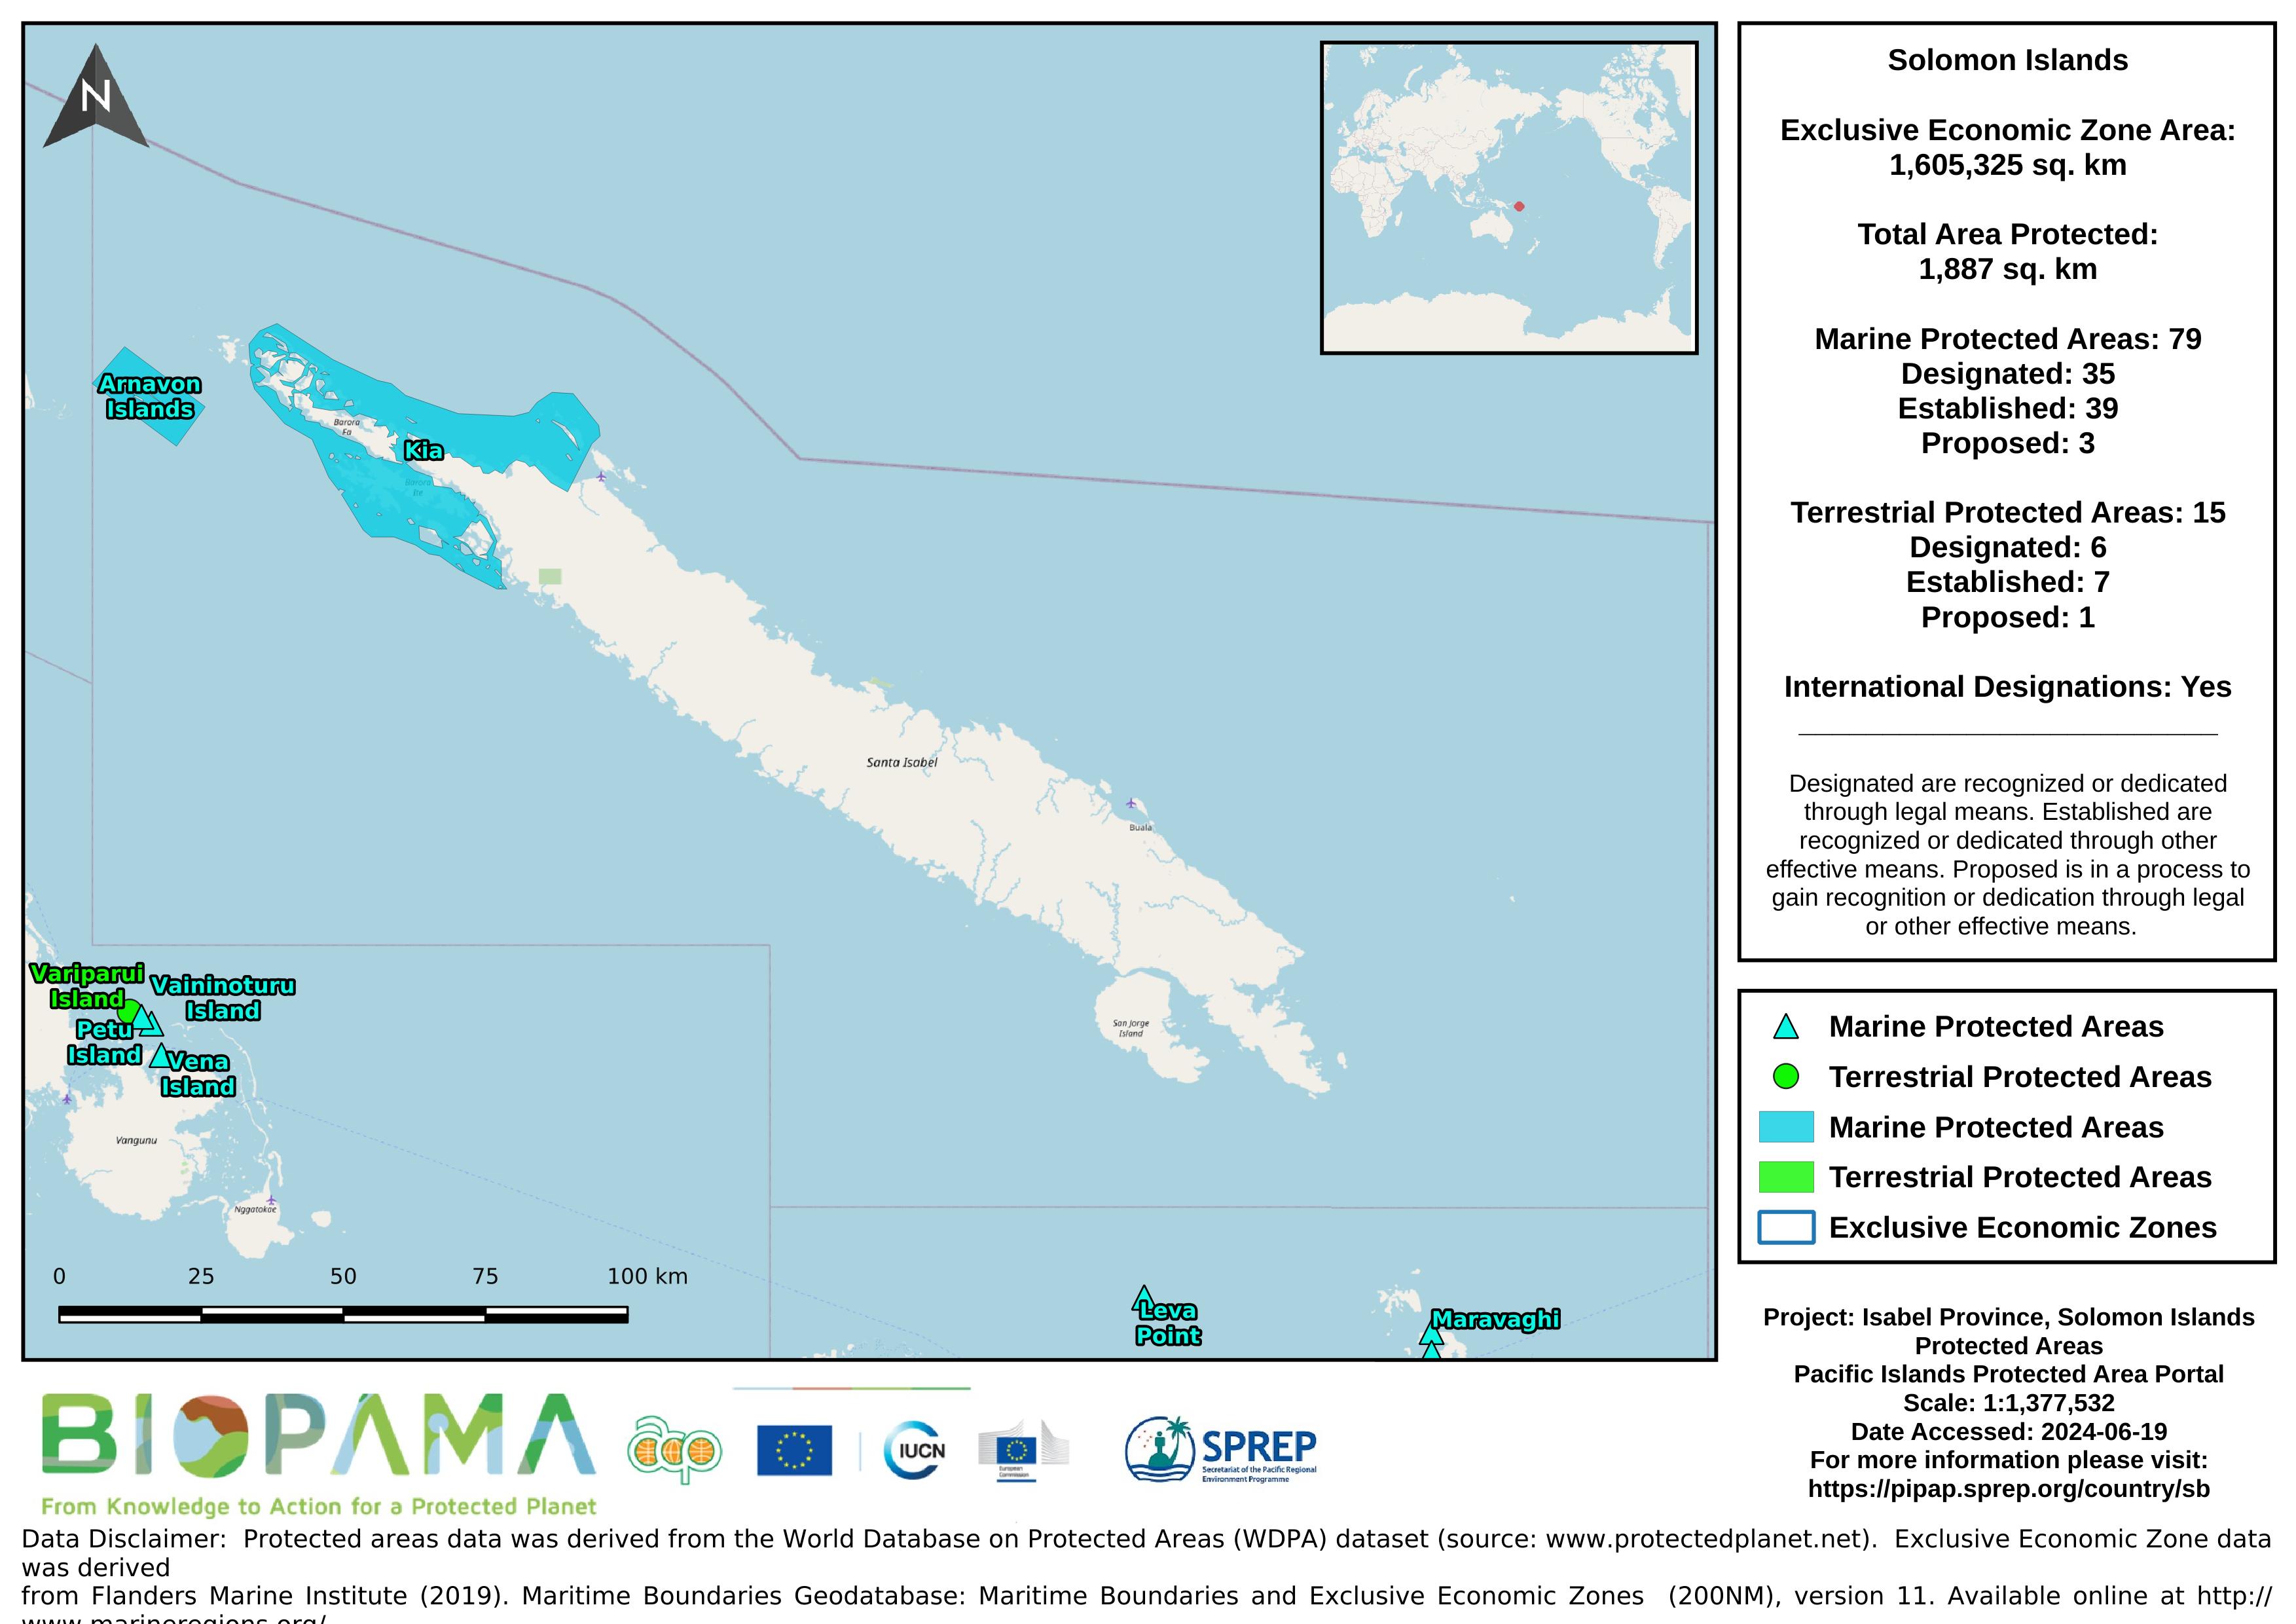
Map of the protected areas for Isabel province in the Solomon Islands with country-level summary statistics on the amount of area under protection, count for each type of protected area (terrestrial or marine), and the count of their designation.
Map of the protected areas for Isabel province in the Solomon Islands with country-level summary statistics on the amount of area under protection, count for each type of protected area (terrestrial or marine), and the count of their designation.
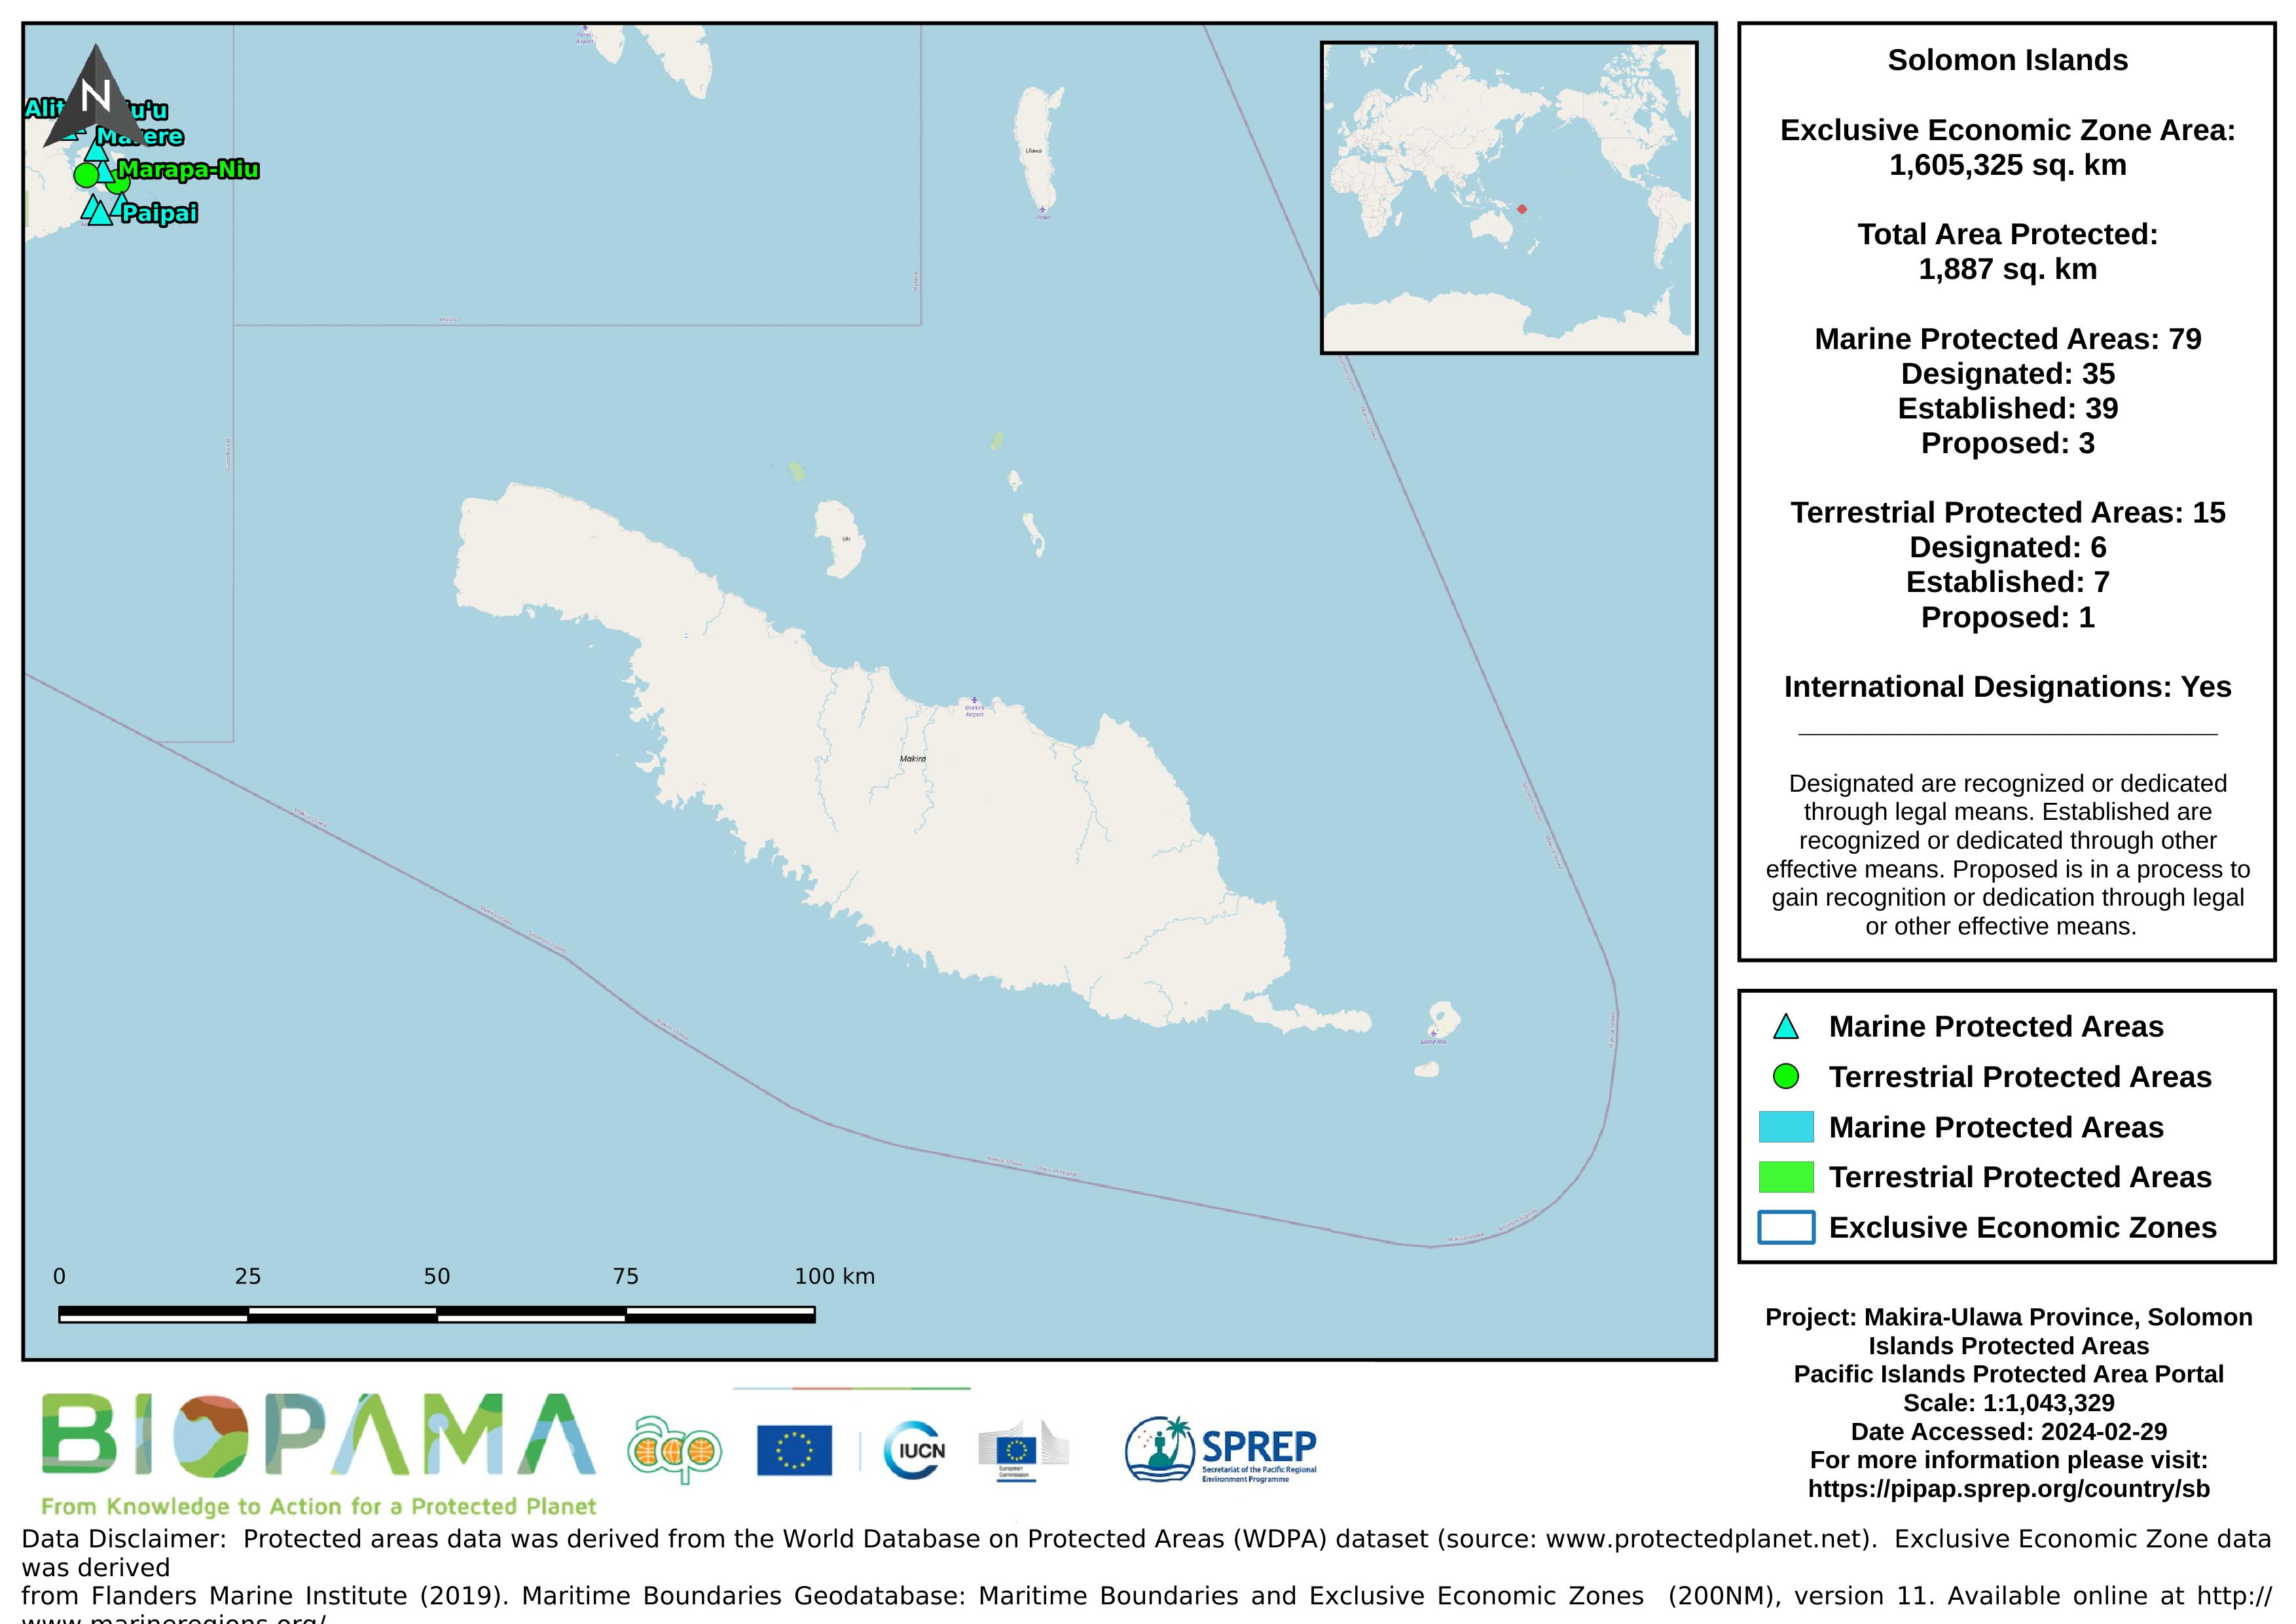
Map of the protected areas for Makira-Ulawa province in the Solomon Islands with country-level summary statistics on the amount of area under protection, count for each type of protected area (terrestrial or marine), and the count of their designation.
Map of the protected areas for Makira-Ulawa province in the Solomon Islands with country-level summary statistics on the amount of area under protection, count for each type of protected area (terrestrial or marine), and the count of their designation.
This is the report for the Reefs at Risk Revisited analysis. Reefs at Risk Revisited is a high-resolution update of the original global analysis, Reefs at Risk: A Map-Based Indicator of Threats to the World’s Coral Reefs. Reefs at Risk Revisited uses a global map of coral reefs at 500-m resolution, which is 64 times more detailed than the 4-km resolution map used in the 1998 analysis, and benefits from improvements in many global data sets used to evaluate threats to reefs (most threat data are at 1 km resolution, which is 16 times more detailed than those used in the 1998 analysis).