This resource contains satellite imagery for the Guadalcanal, Central, and Malaita Islands in the Solomon Islands. The imagery was collected on January 23, February 22, April 7, June 24, and October 2, 2020.
More specially, this resource contains a raster file of RGB imagery at 10-meter resolution, using Level-2A products when available. Level-2A products include atmospheric correction and represent bottom of atmosphere reflectance values in the images. When Level-2A products were not available, Level-1C (top of atmosphere) products were used.
10 Field Reports capturing the first rounds of consultations by Solomon Islands Government in 2019 for the development of an Ocean Plan (by 2020).
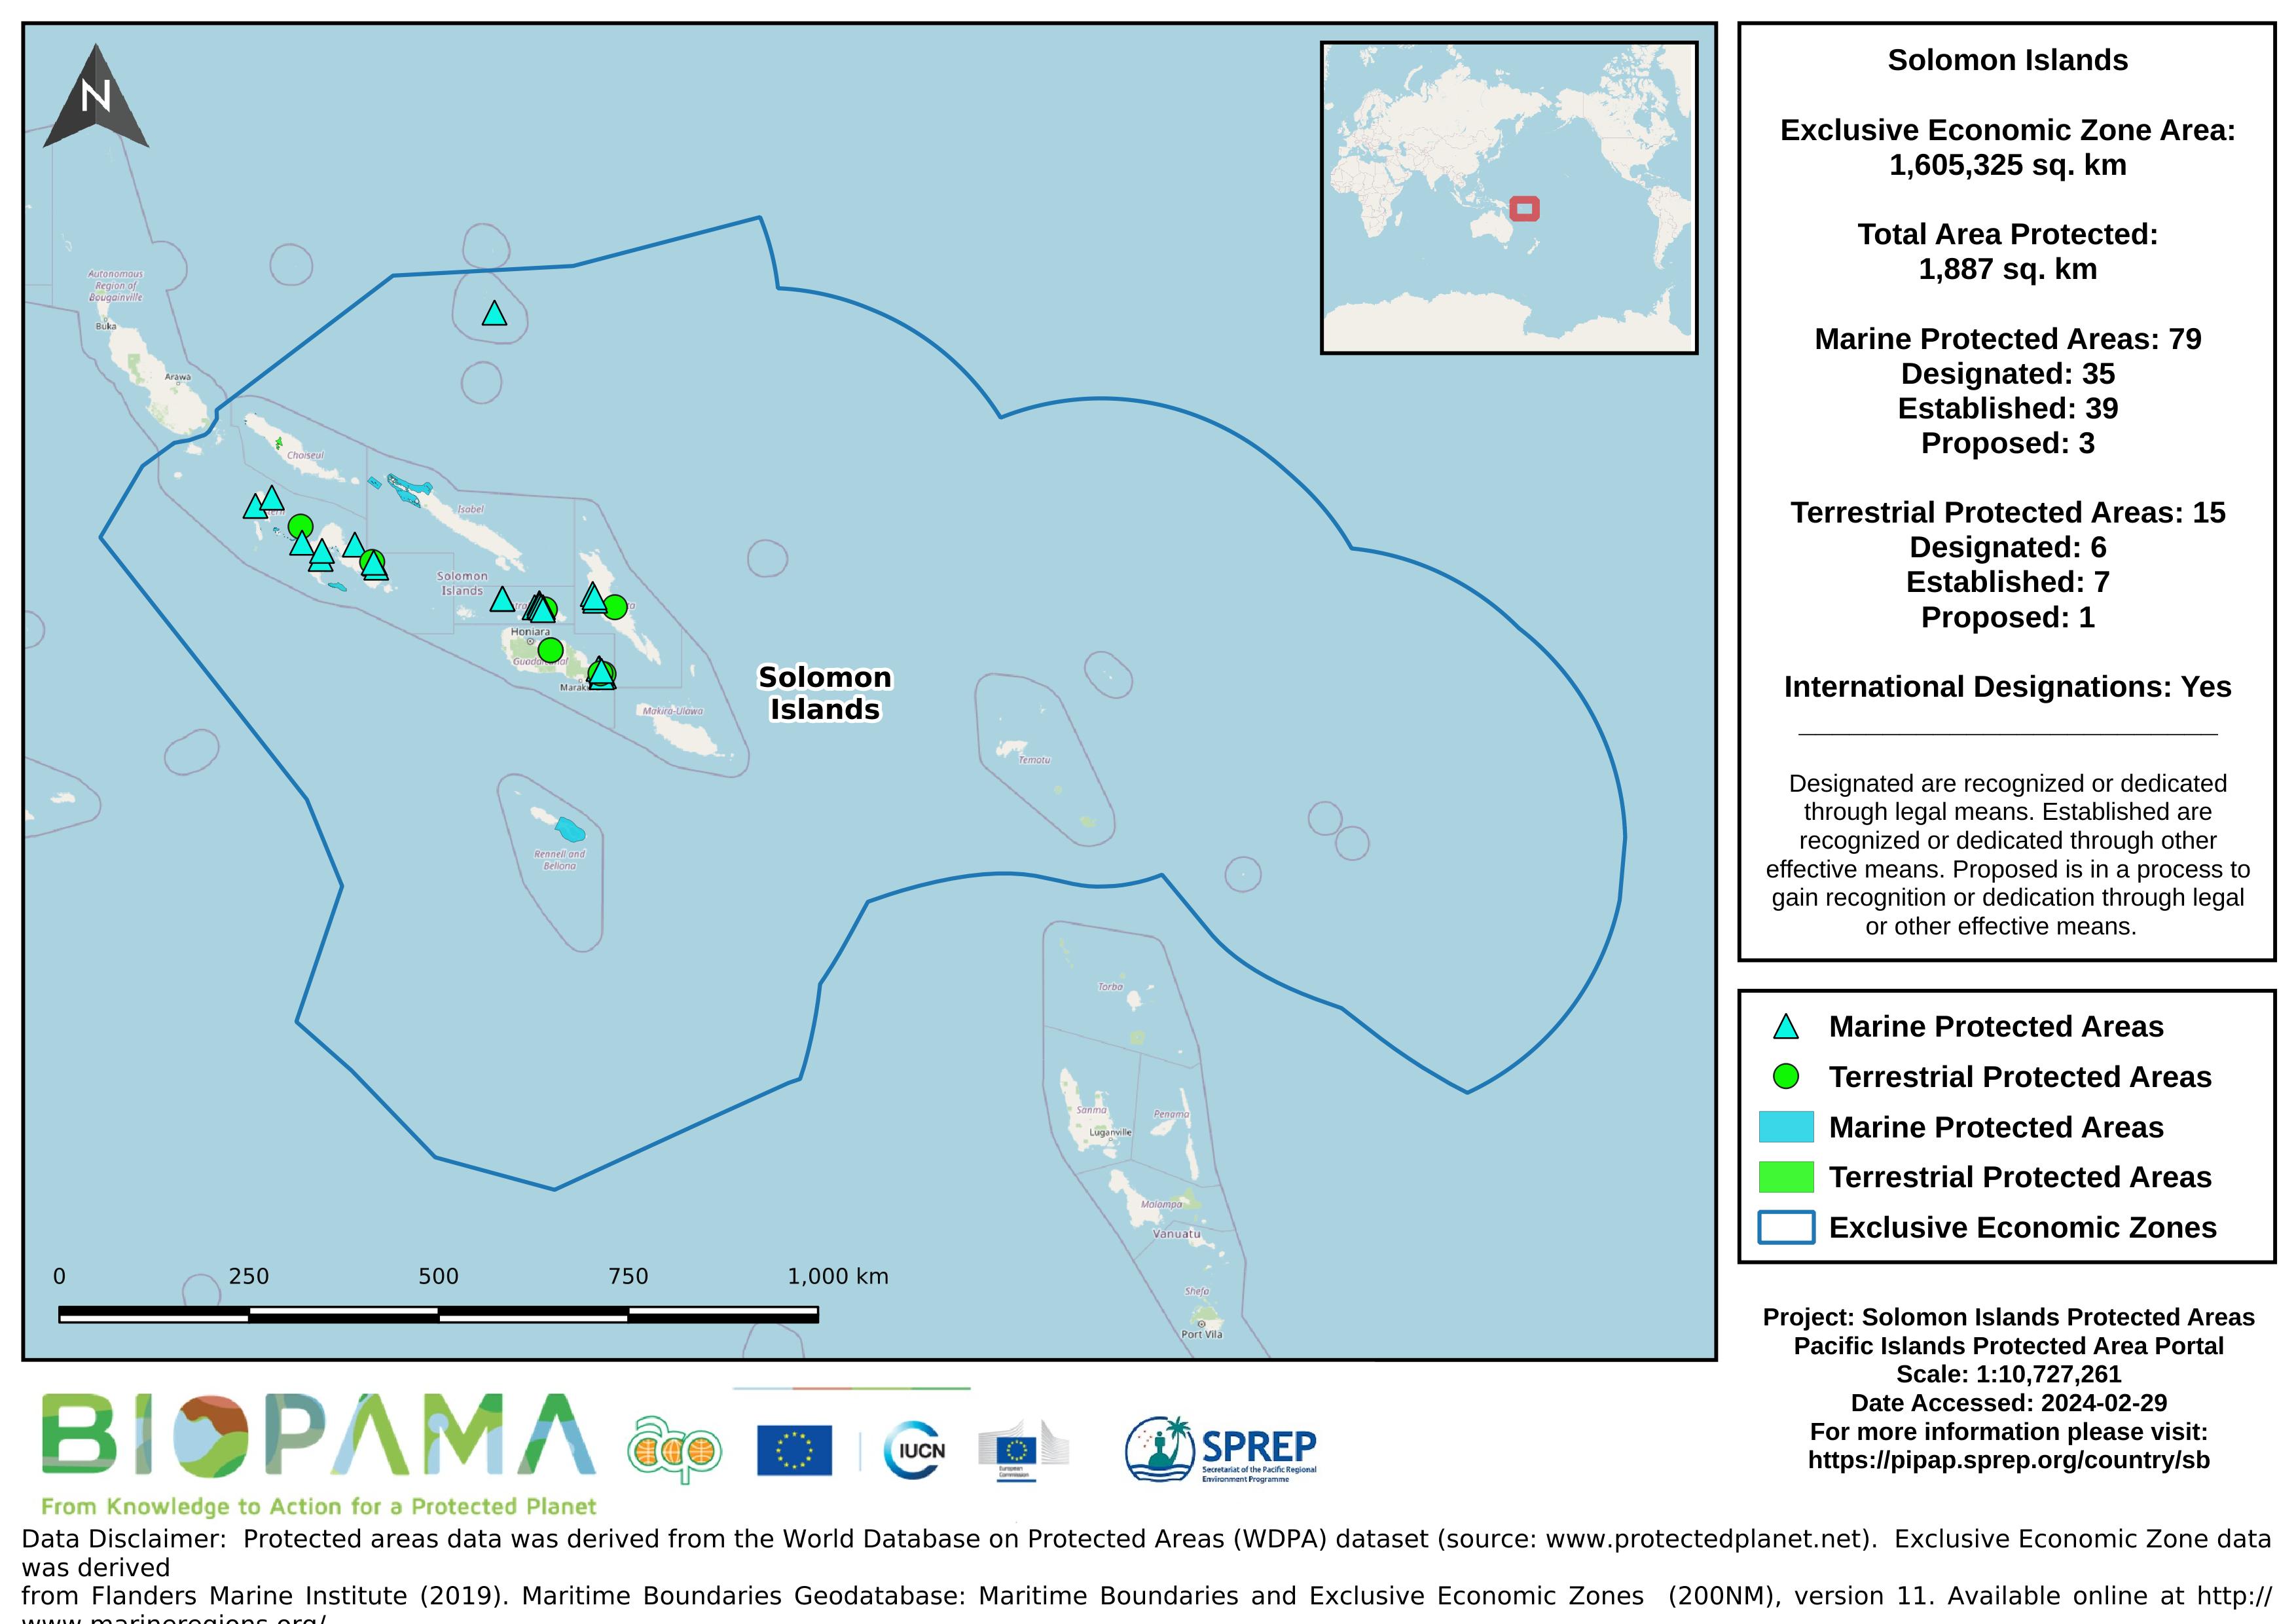
Map of the protected areas for the Solomon Islands with country-level summary statistics on the amount of area under protection, count for each type of protected area (terrestrial or marine), and the count of their designation.
Map of the protected areas for the Solomon Islands with country-level summary statistics on the amount of area under protection, count for each type of protected area (terrestrial or marine), and the count of their designation.
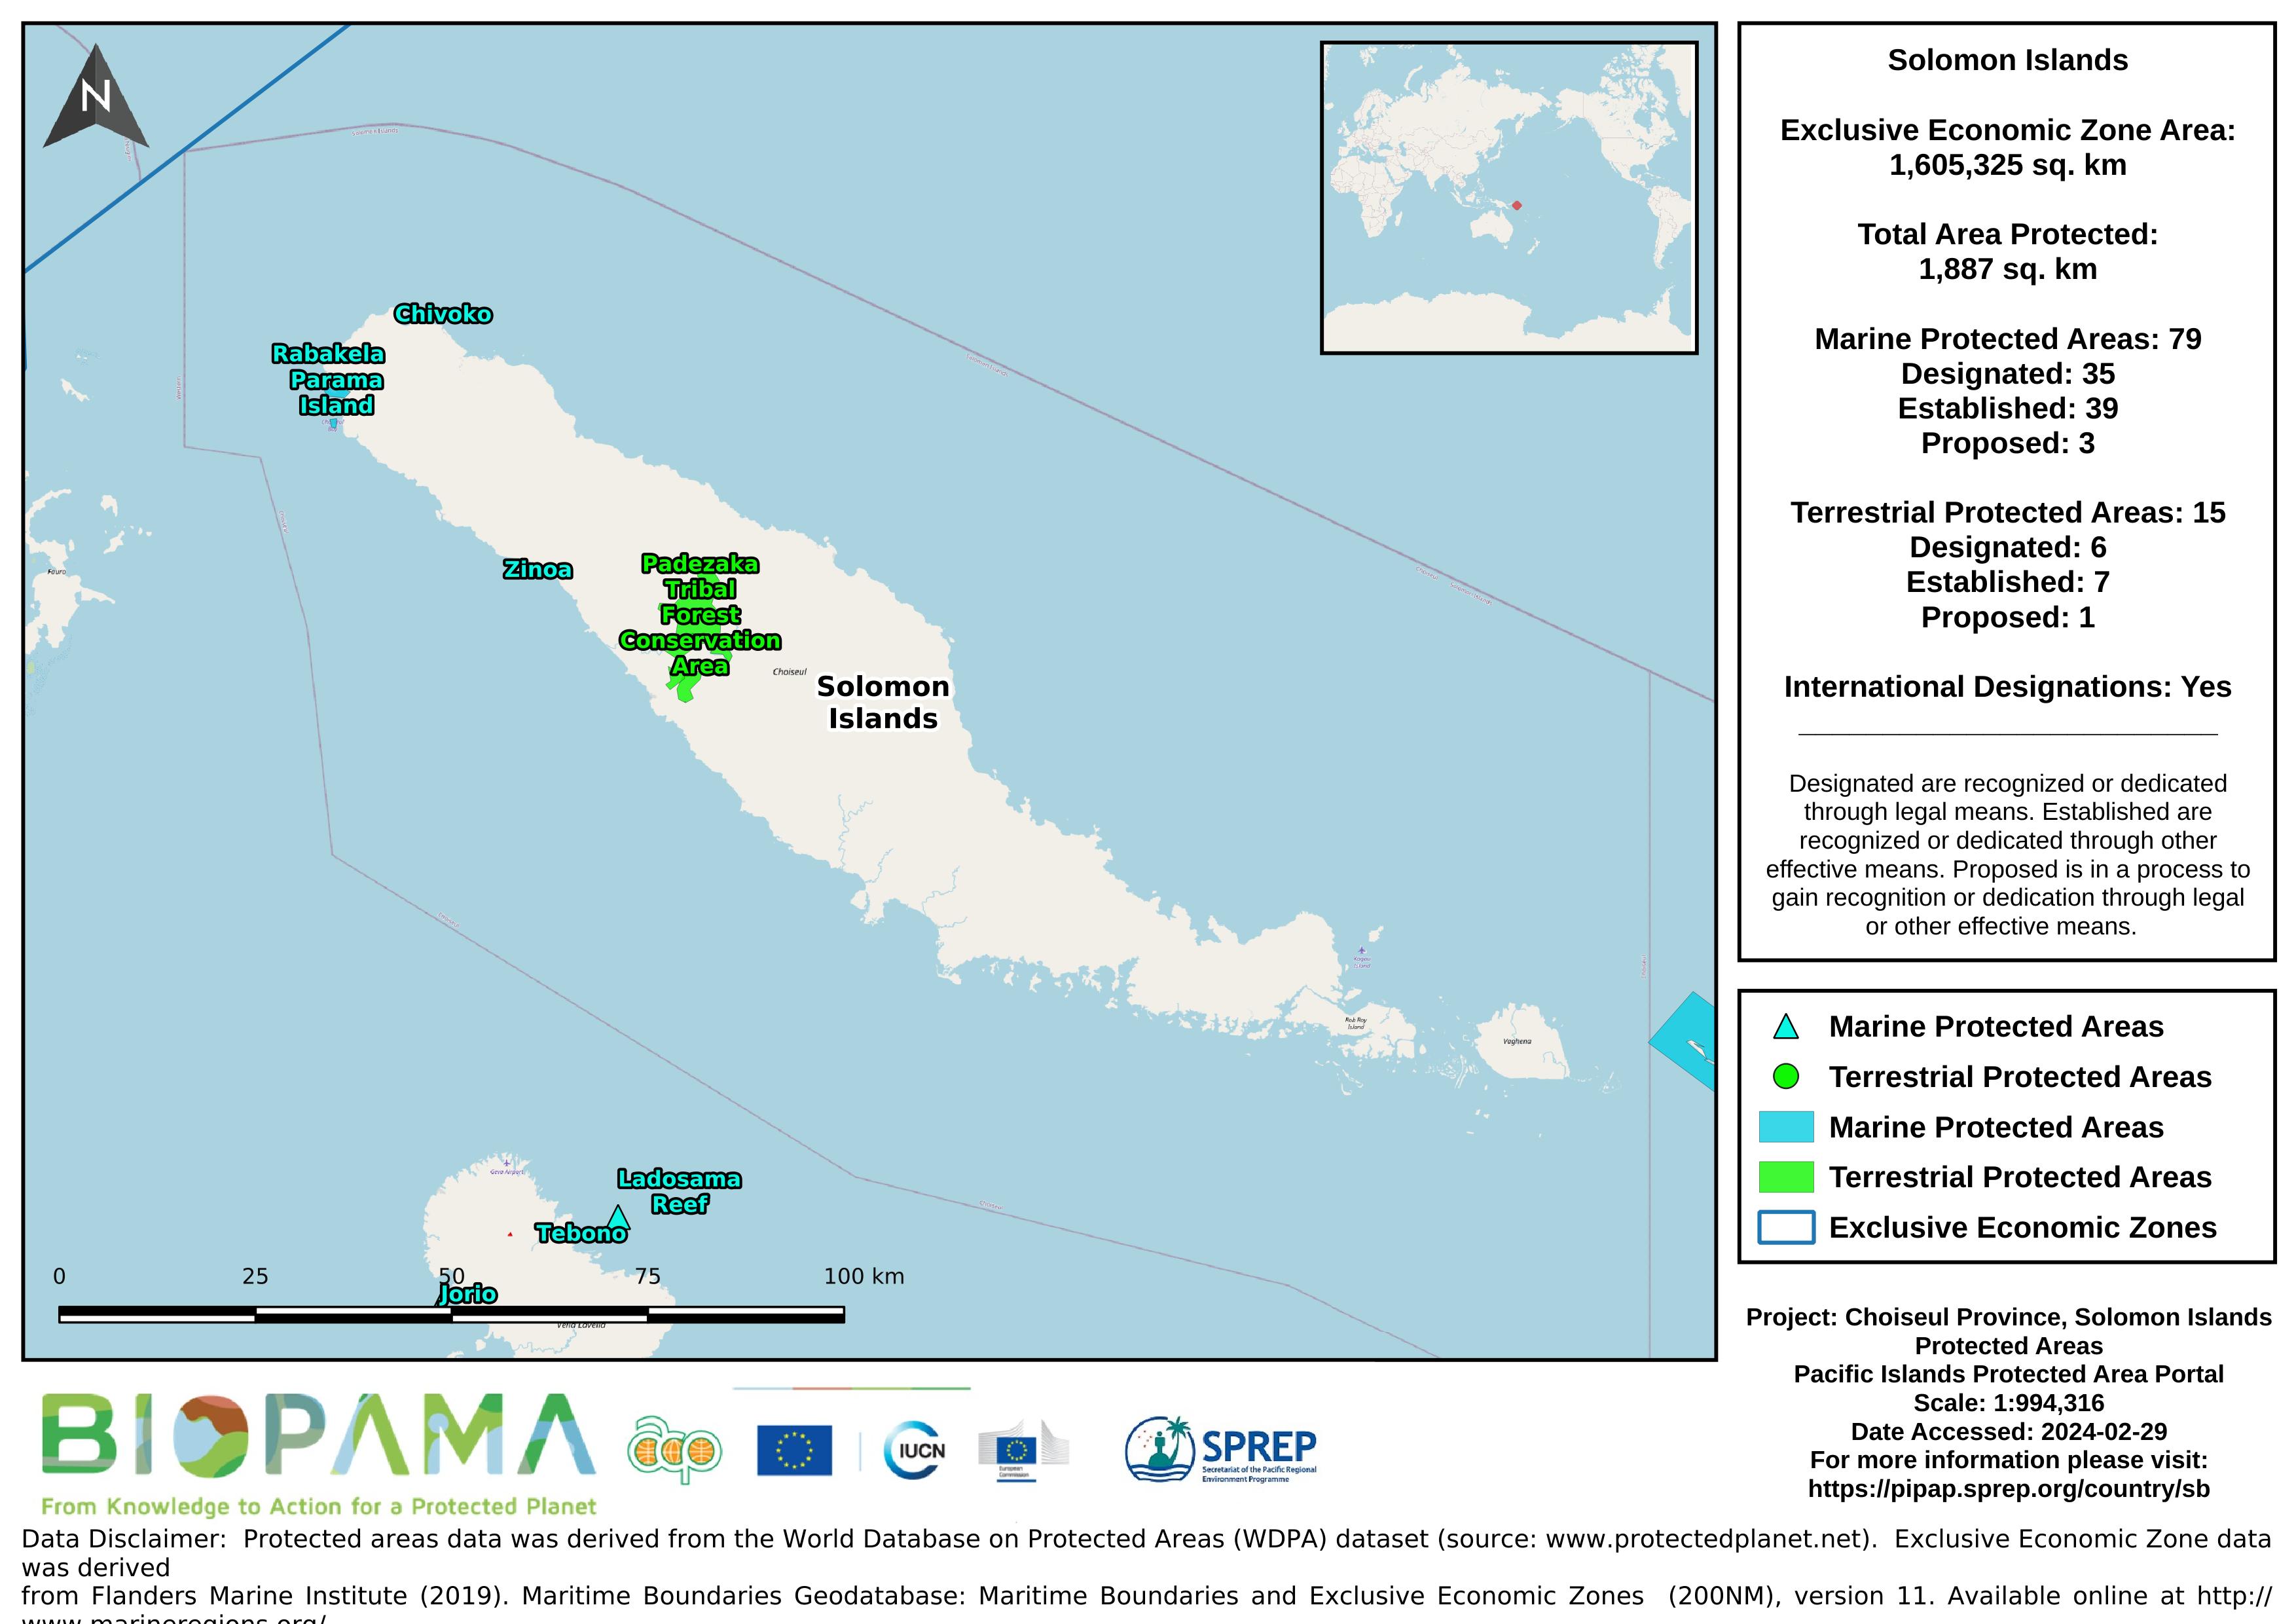
Map of the protected areas for Choiseul province in the Solomon Islands with country-level summary statistics on the amount of area under protection, count for each type of protected area (terrestrial or marine), and the count of their designation.
Map of the protected areas for Choiseul province in the Solomon Islands with country-level summary statistics on the amount of area under protection, count for each type of protected area (terrestrial or marine), and the count of their designation.
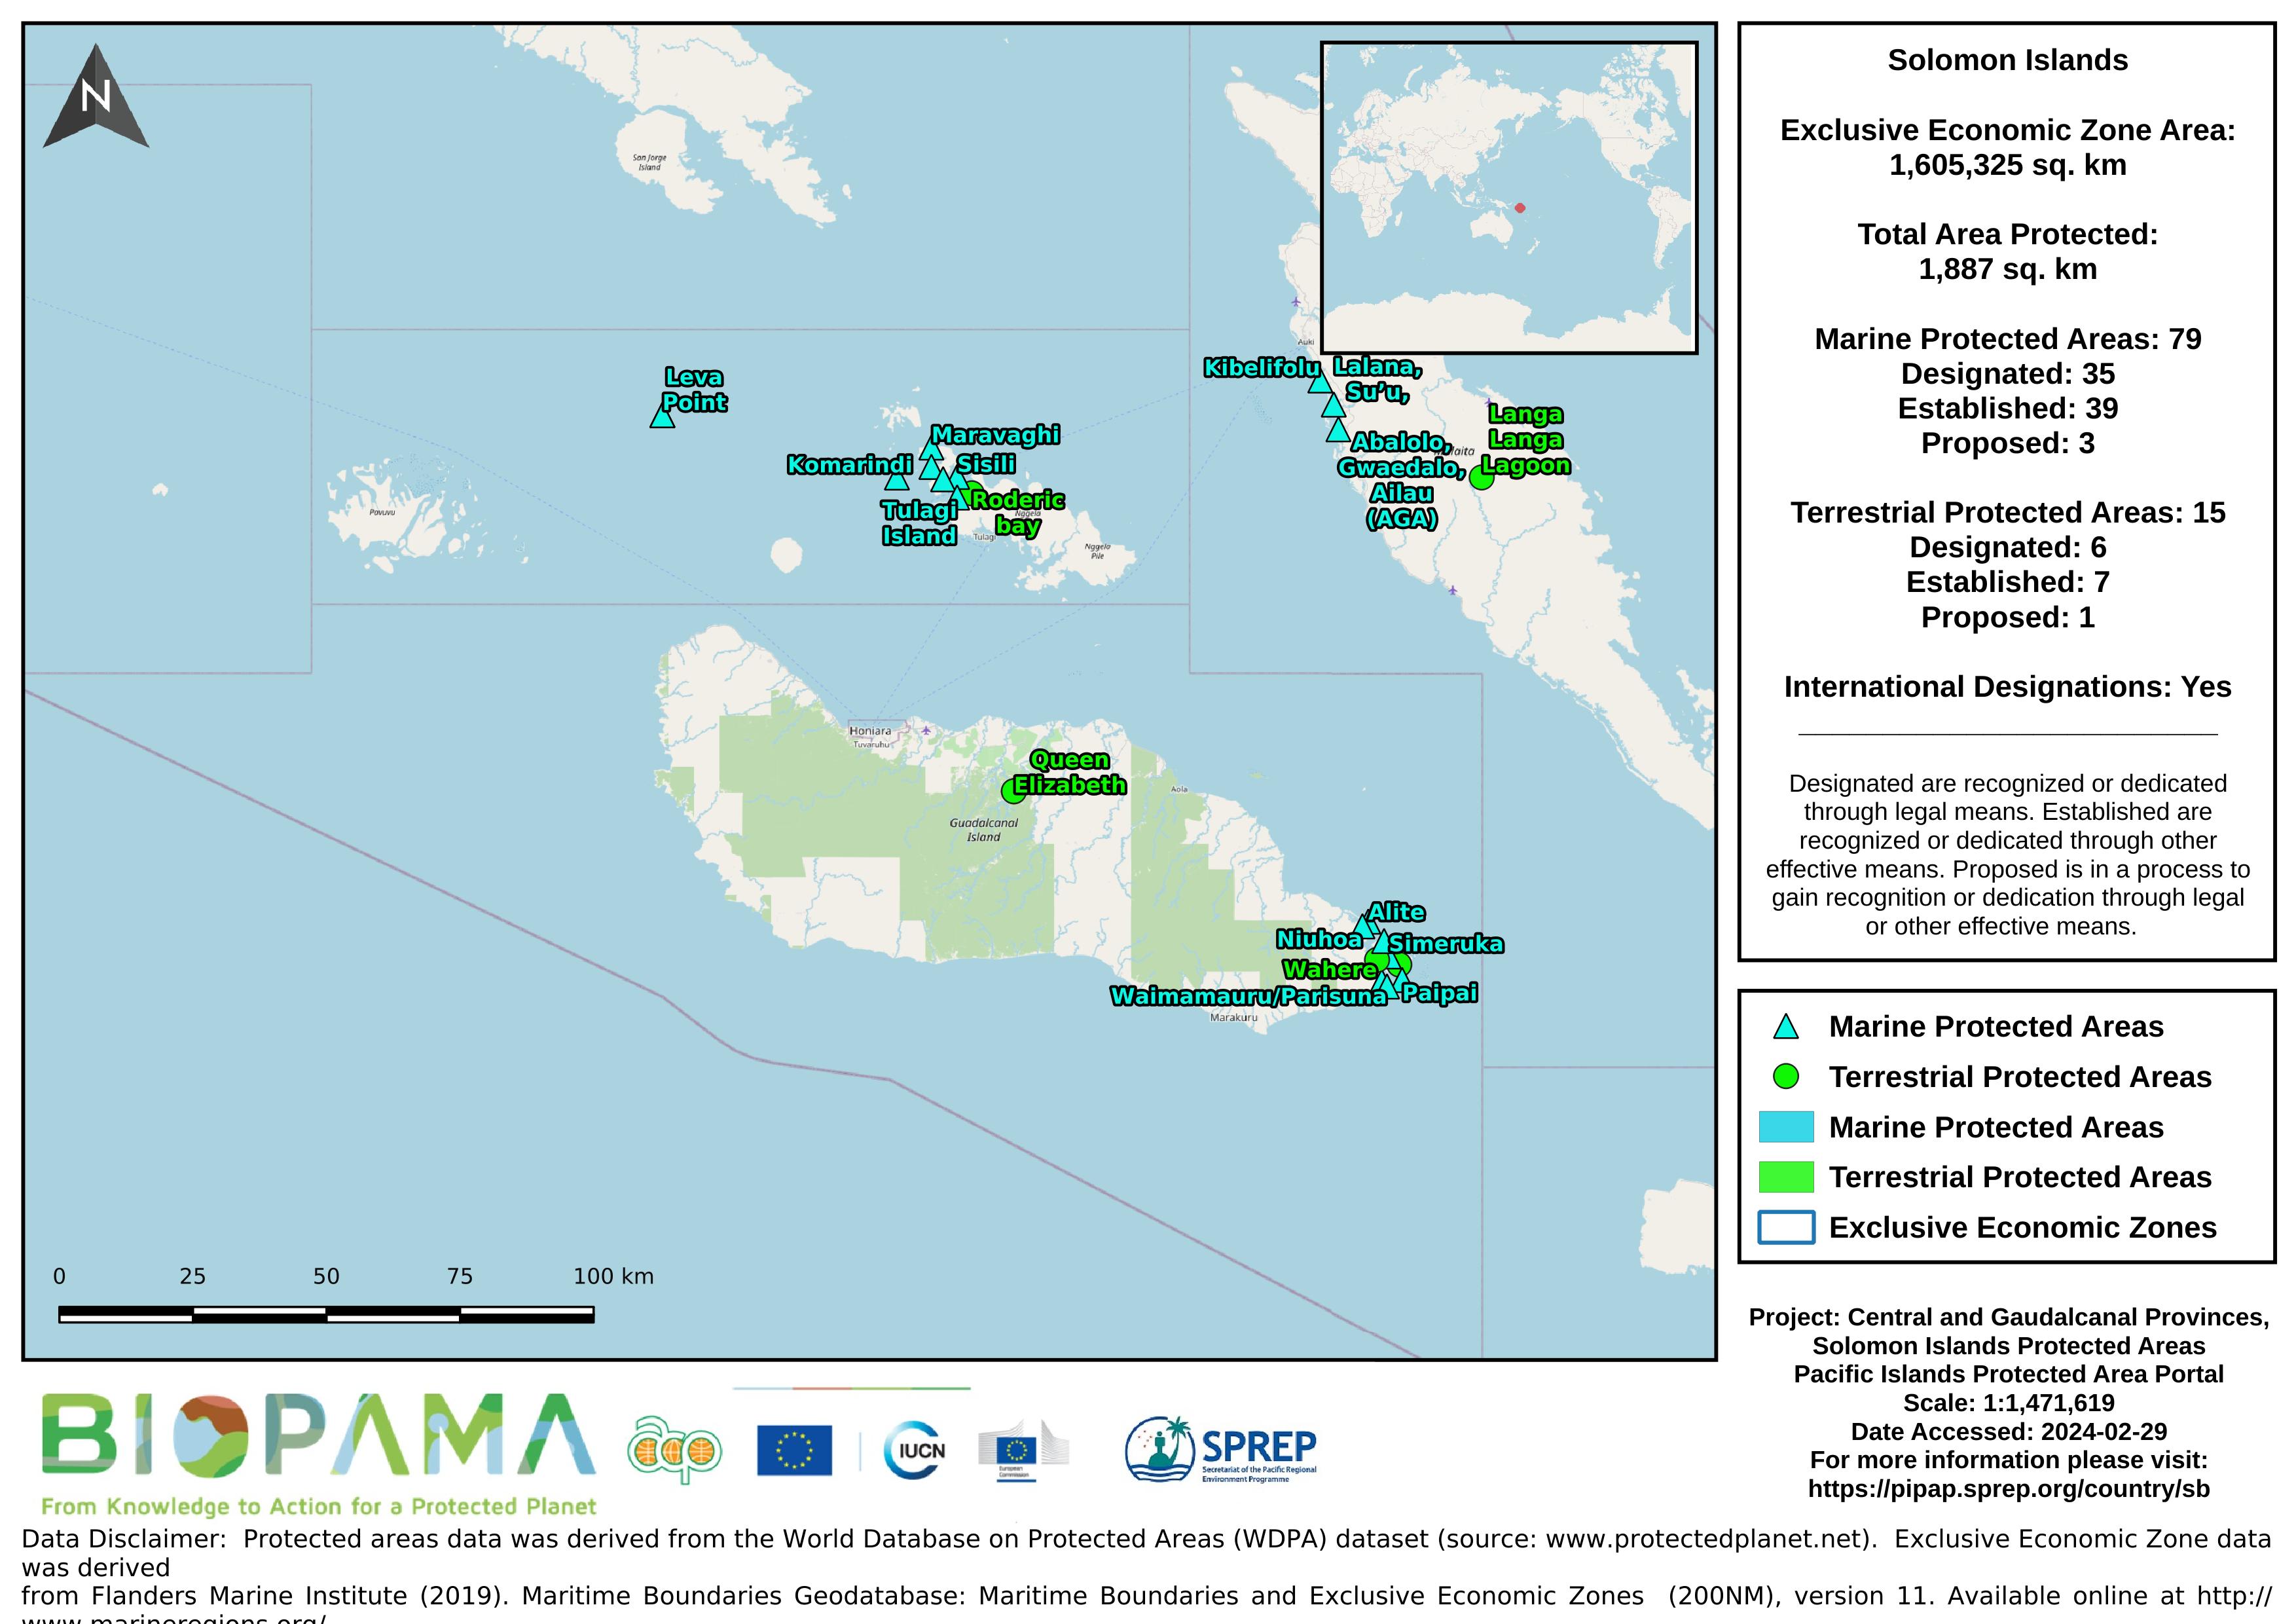
Map of the protected areas for Guadalcanal and Central provinces in the Solomon Islands with country-level summary statistics on the amount of area under protection, count for each type of protected area (terrestrial or marine), and the count of their designation.
Map of the protected areas for Guadalcanal and Central provinces in the Solomon Islands with country-level summary statistics on the amount of area under protection, count for each type of protected area (terrestrial or marine), and the count of their designation.
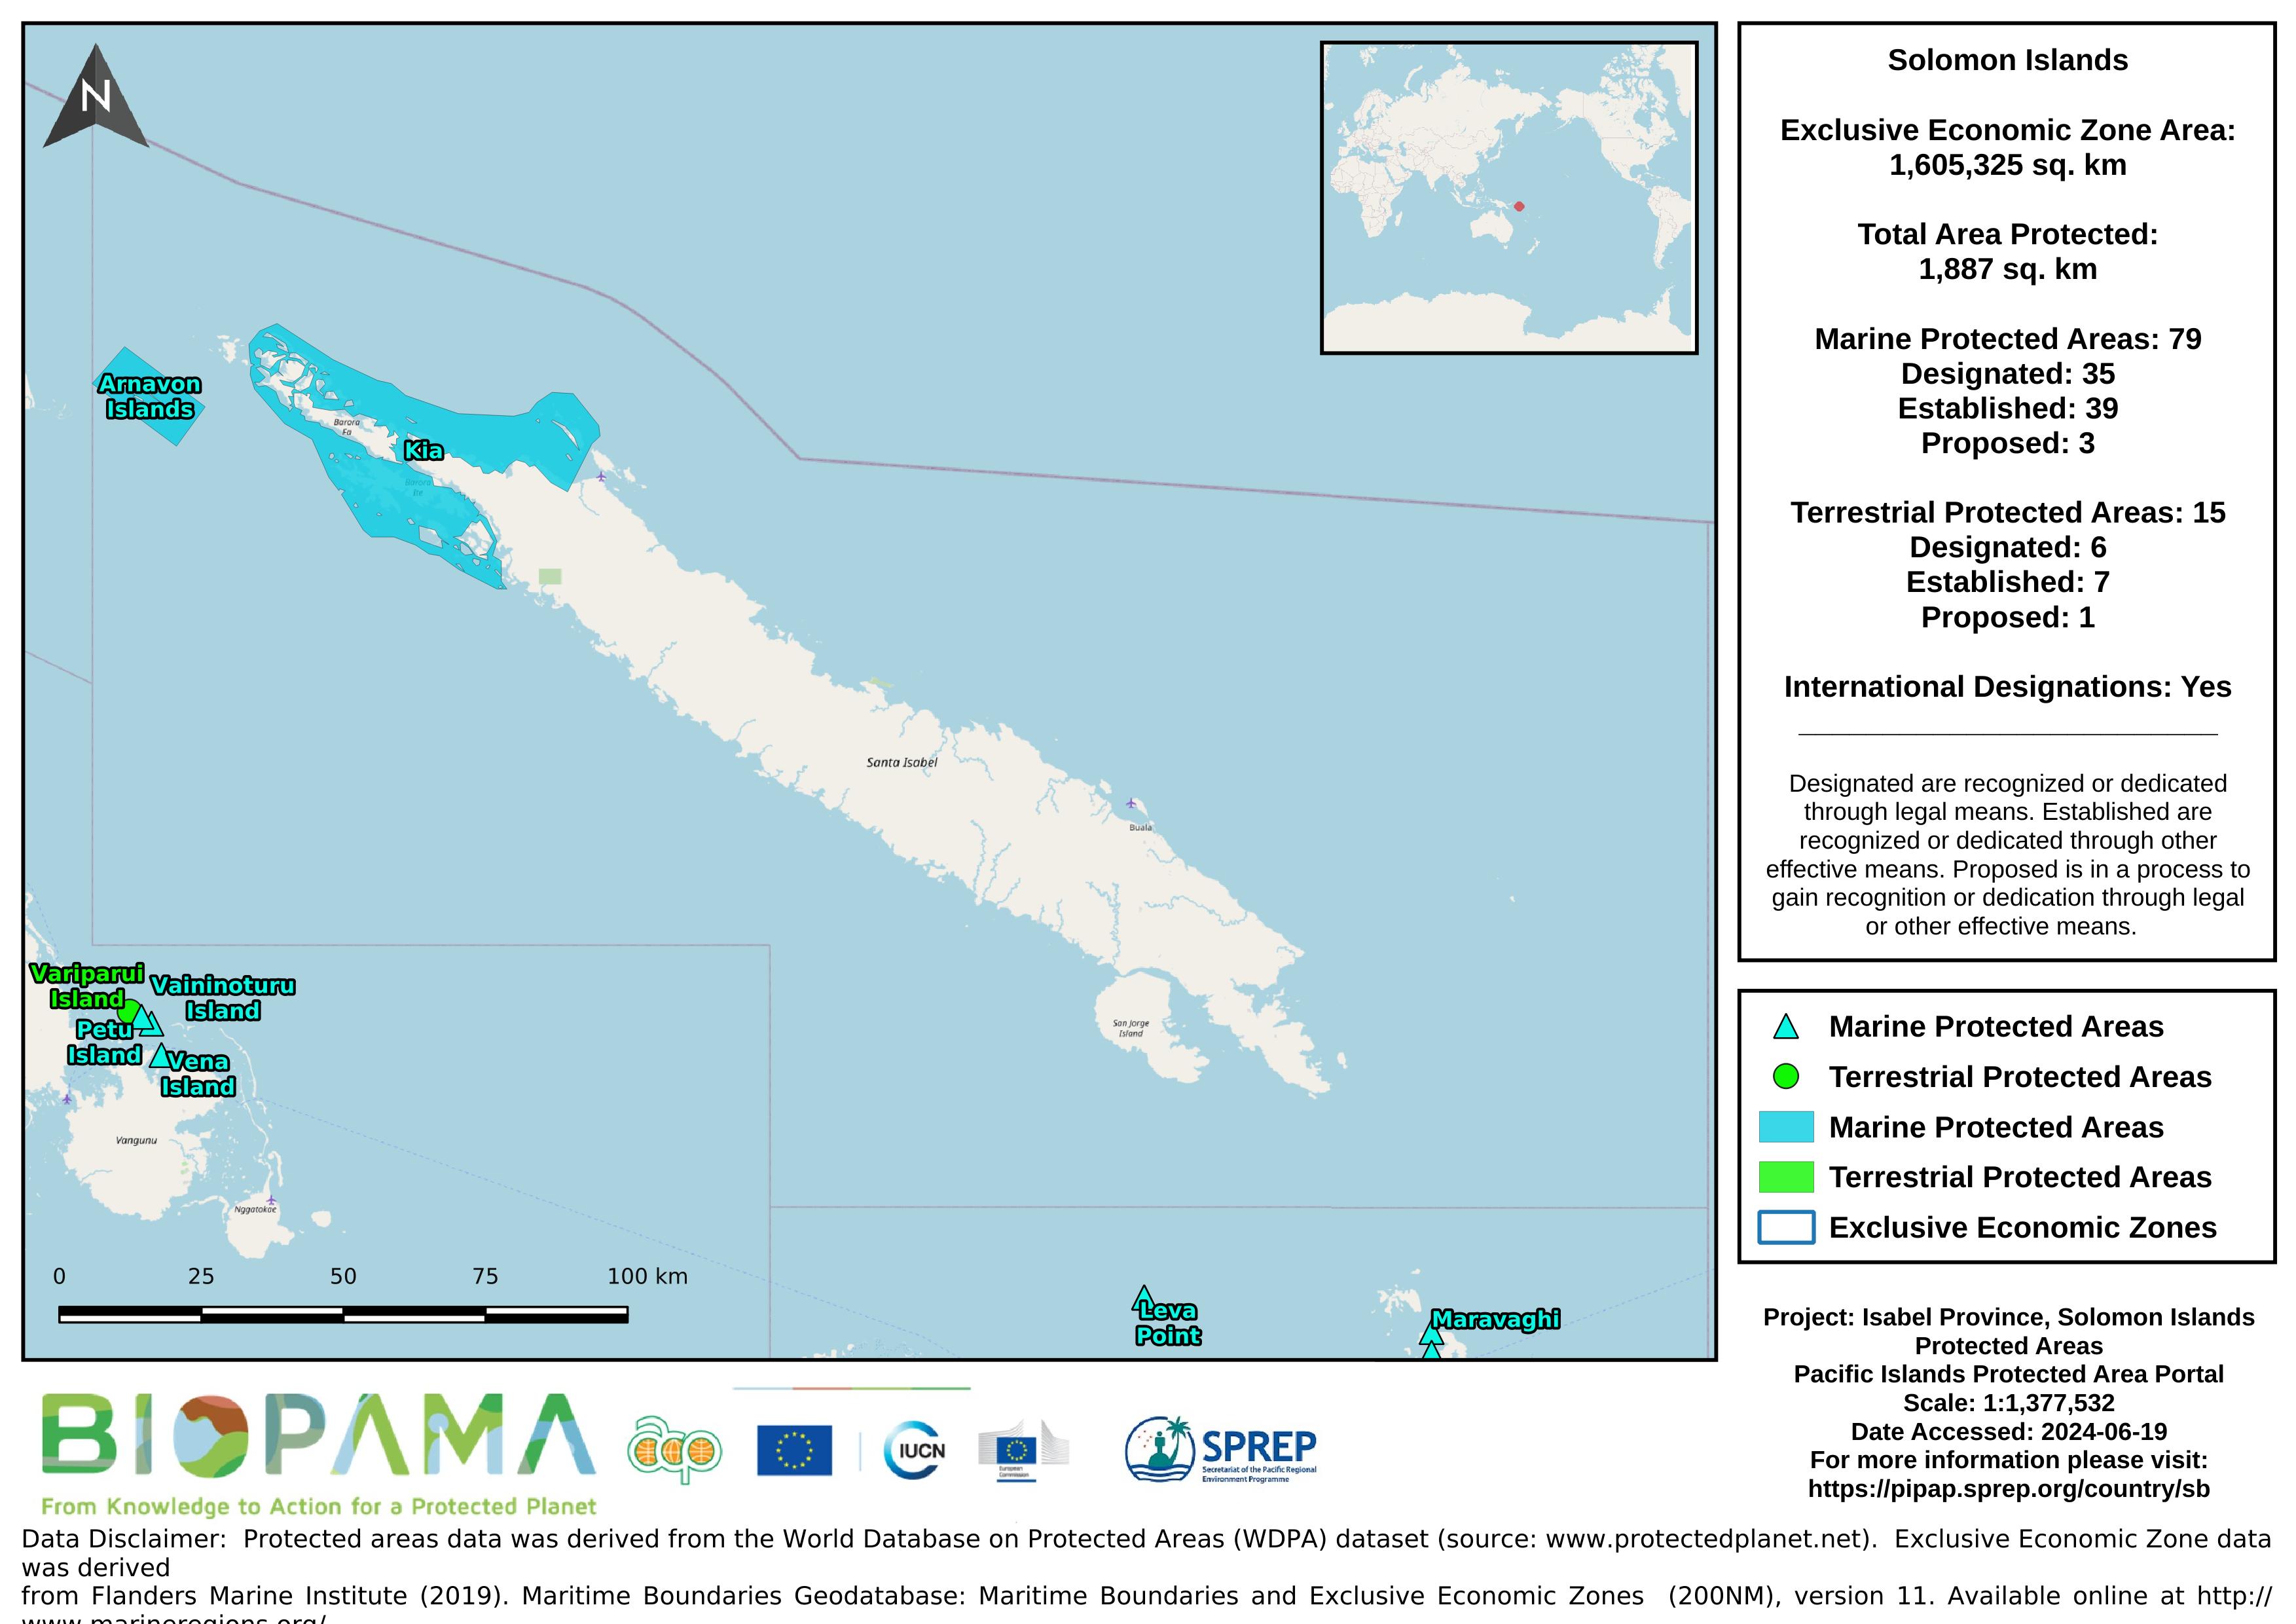
Map of the protected areas for Isabel province in the Solomon Islands with country-level summary statistics on the amount of area under protection, count for each type of protected area (terrestrial or marine), and the count of their designation.
Map of the protected areas for Isabel province in the Solomon Islands with country-level summary statistics on the amount of area under protection, count for each type of protected area (terrestrial or marine), and the count of their designation.
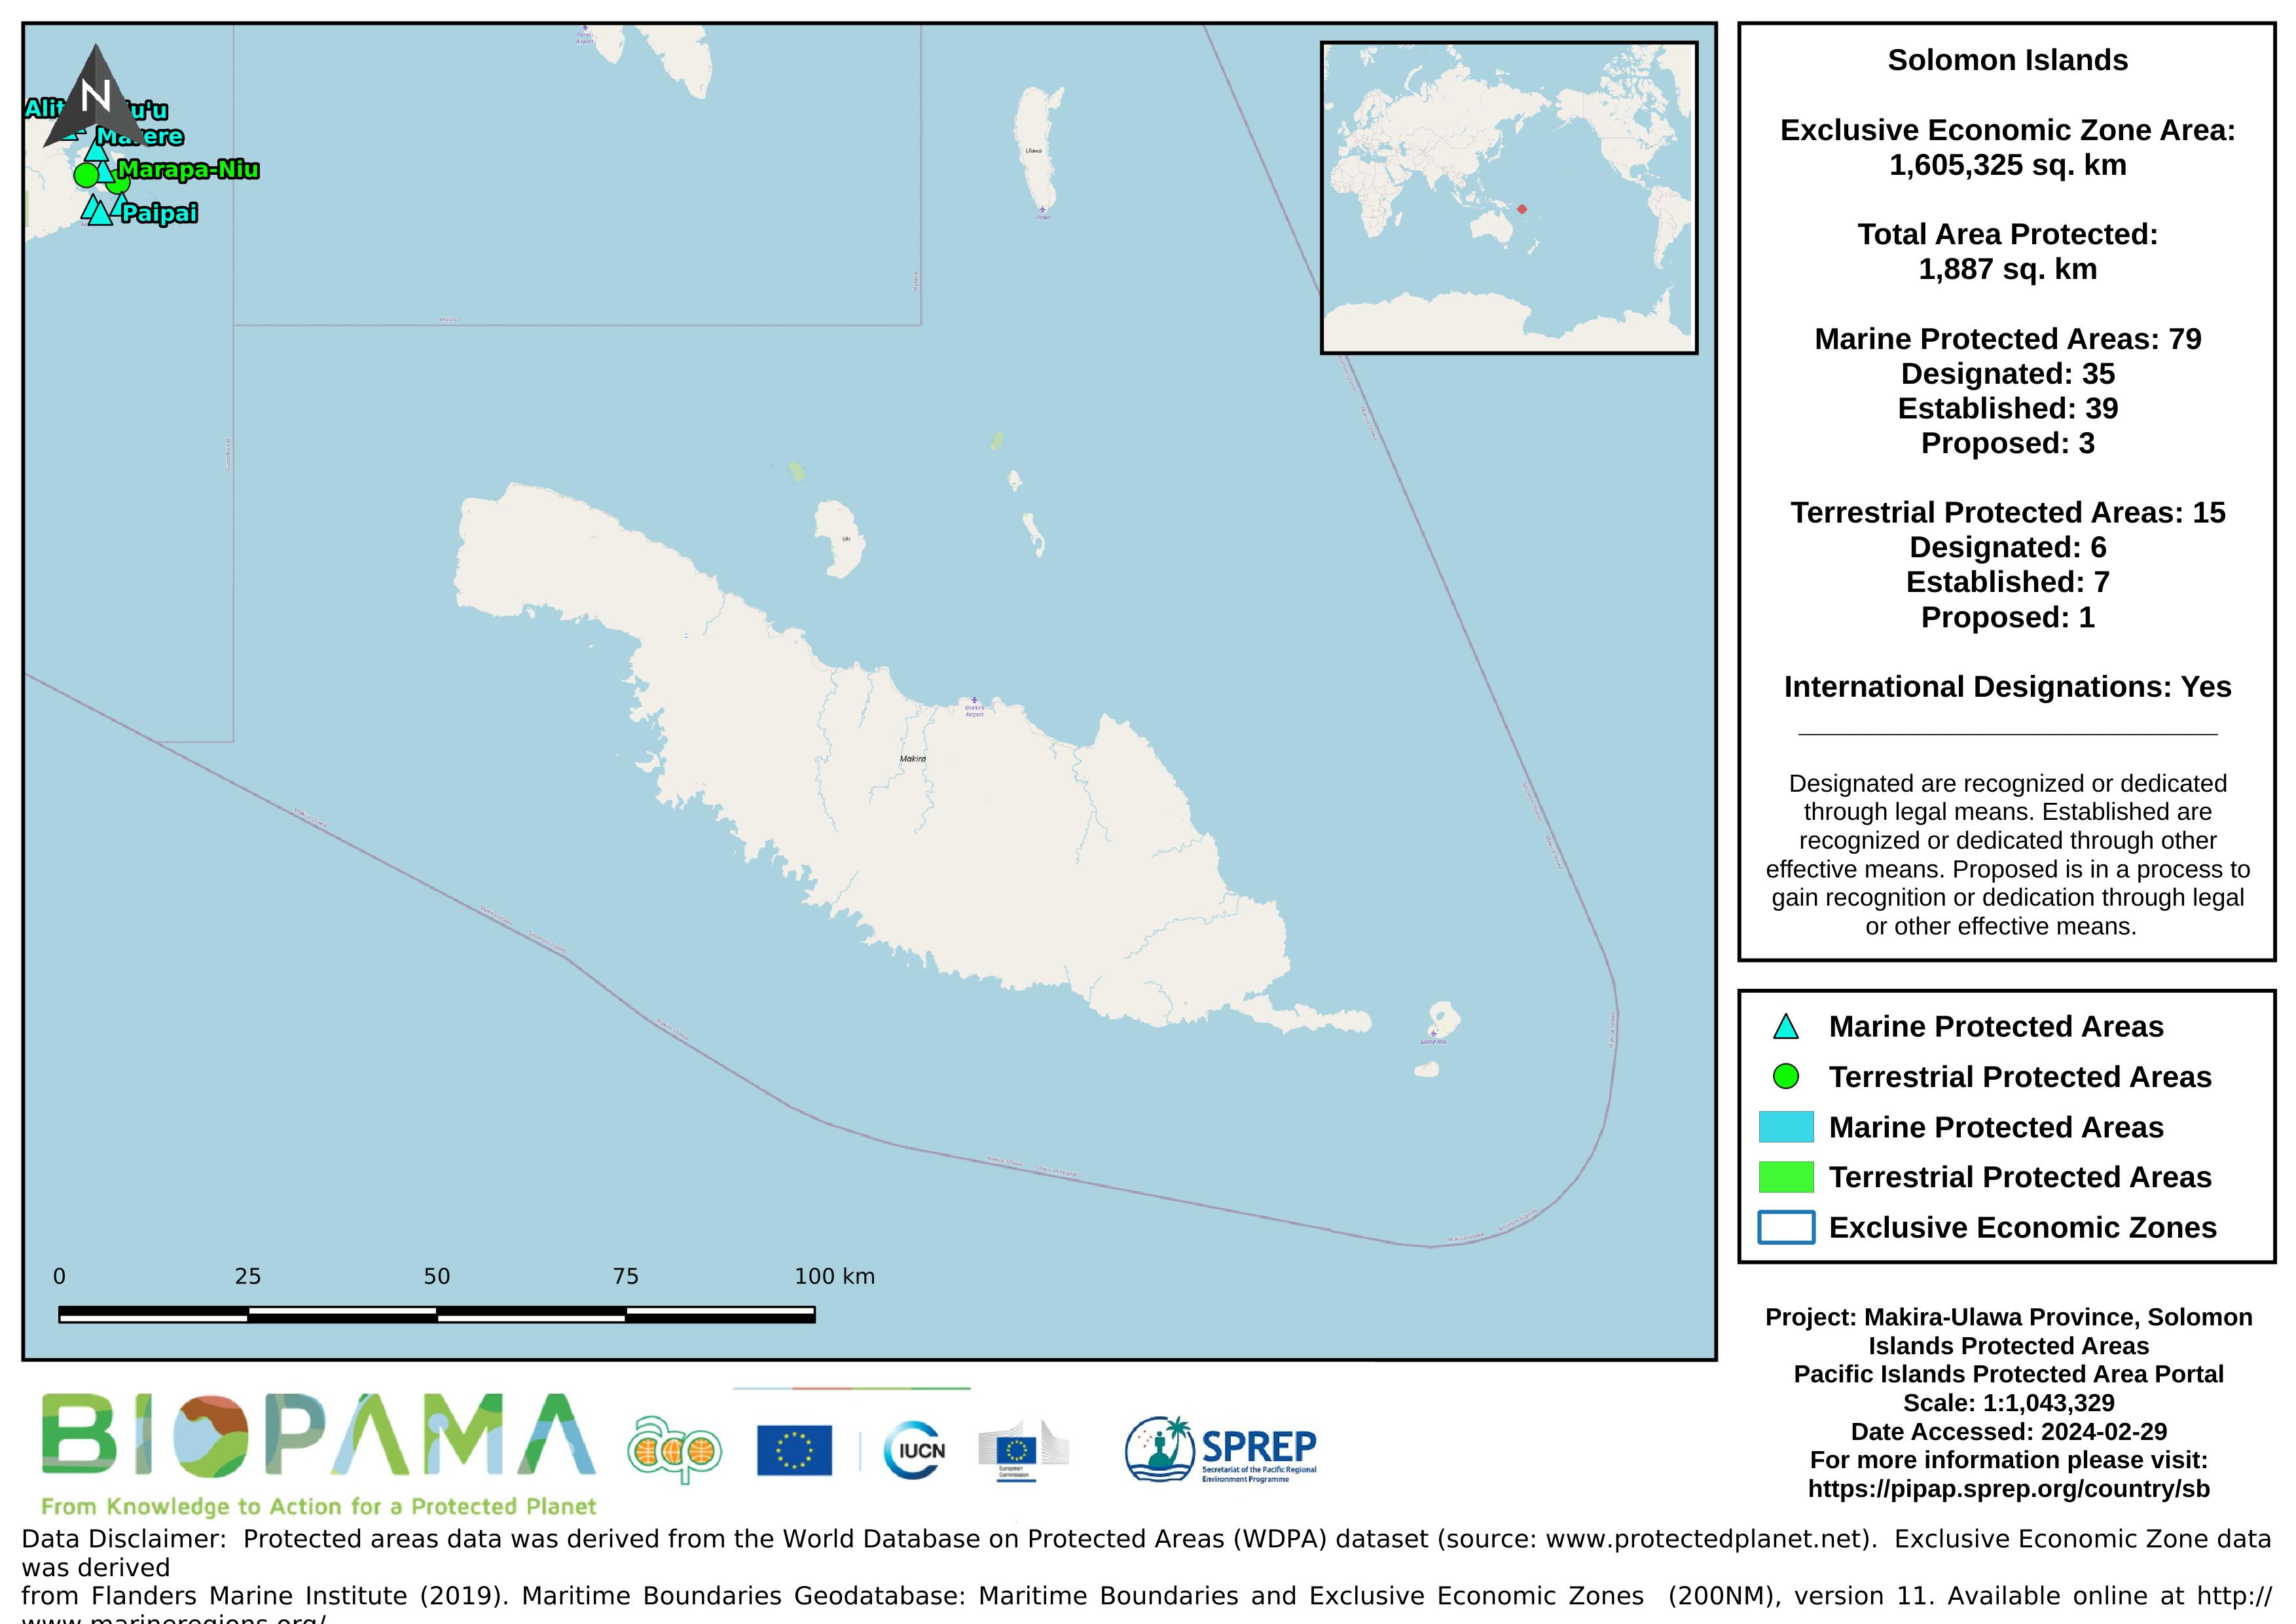
Map of the protected areas for Makira-Ulawa province in the Solomon Islands with country-level summary statistics on the amount of area under protection, count for each type of protected area (terrestrial or marine), and the count of their designation.
Map of the protected areas for Makira-Ulawa province in the Solomon Islands with country-level summary statistics on the amount of area under protection, count for each type of protected area (terrestrial or marine), and the count of their designation.
This is the report for the Reefs at Risk Revisited analysis. Reefs at Risk Revisited is a high-resolution update of the original global analysis, Reefs at Risk: A Map-Based Indicator of Threats to the World’s Coral Reefs. Reefs at Risk Revisited uses a global map of coral reefs at 500-m resolution, which is 64 times more detailed than the 4-km resolution map used in the 1998 analysis, and benefits from improvements in many global data sets used to evaluate threats to reefs (most threat data are at 1 km resolution, which is 16 times more detailed than those used in the 1998 analysis).
This dataset contains GIS data (raster and shapefiles) for the local threats to coral reefs: coastal development, integrated local, marine pollution, overfishing, and watershed pollution.
The Global Mangrove Watch (GMW) is a collaboration between Aberystwyth University (U.K.), solo Earth Observation (soloEO; Japan), Wetlands International the World Conservation Monitoring Centre (UNEP-WCMC) and the Japan Aerospace Exploration Agency (JAXA).
Conservation International, GRID-Arendal and Geoscience Australia recently collaborated to produce a map of the global distribution of seafloor geomorphic features. The global seafloor geomorphic features map represents an important contribution towards the understanding of the distribution of blue habitats. Certain geomorphic feature are known to be good surrogates for biodiversity. For example, seamounts support a different suite of species to abyssal plains.
GEBCO’s gridded bathymetric data set, the GEBCO_2020 grid, is a global terrain model for ocean and land at 15 arc-second intervals. It is accompanied by a Type Identifier (TID) Grid that gives information on the types of source data that the GEBCO_2020 Grid is based.
If the data sets are used in a presentation or publication then we ask that you acknowledge the source.This should be of the form: GEBCO Compilation Group (2020) GEBCO 2020 Grid (doi:10.5285/a29c5465-b138-234d-e053-6c86abc040b9)
Raster data representing the mean levels of chlorophyll in mg/m3 for the surface water layer. The data are available for global-scale applications at a spatial resolution of 5 arcmin (approximately 9.2 km at the equator).
Marine data layers for present conditions were produced with climate data describing monthly averages for the period 2000–2014, obtained from pre-processed global ocean re-analyses combining satellite and in situ observations at regular two- and three-dimensional spatial grids.
Raster data representing the mean levels of dissolved oxygen in µmol/m3 for the surface water layer. The data are available for global-scale applications at a spatial resolution of 5 arcmin (approximately 9.2 km at the equator).
Marine data layers for present conditions were produced with climate data describing monthly averages for the period 2000–2014, obtained from pre-processed global ocean re-analyses combining satellite and in situ observations at regular two- and three-dimensional spatial grids.
Raster data representing the mean levels of nitrate in µmol/m3 for the surface water layer. The data are available for global-scale applications at a spatial resolution of 5 arcmin (approximately 9.2 km at the equator).
Marine data layers for present conditions were produced with climate data describing monthly averages for the period 2000–2014, obtained from pre-processed global ocean re-analyses combining satellite and in situ observations at regular two- and three-dimensional spatial grids.