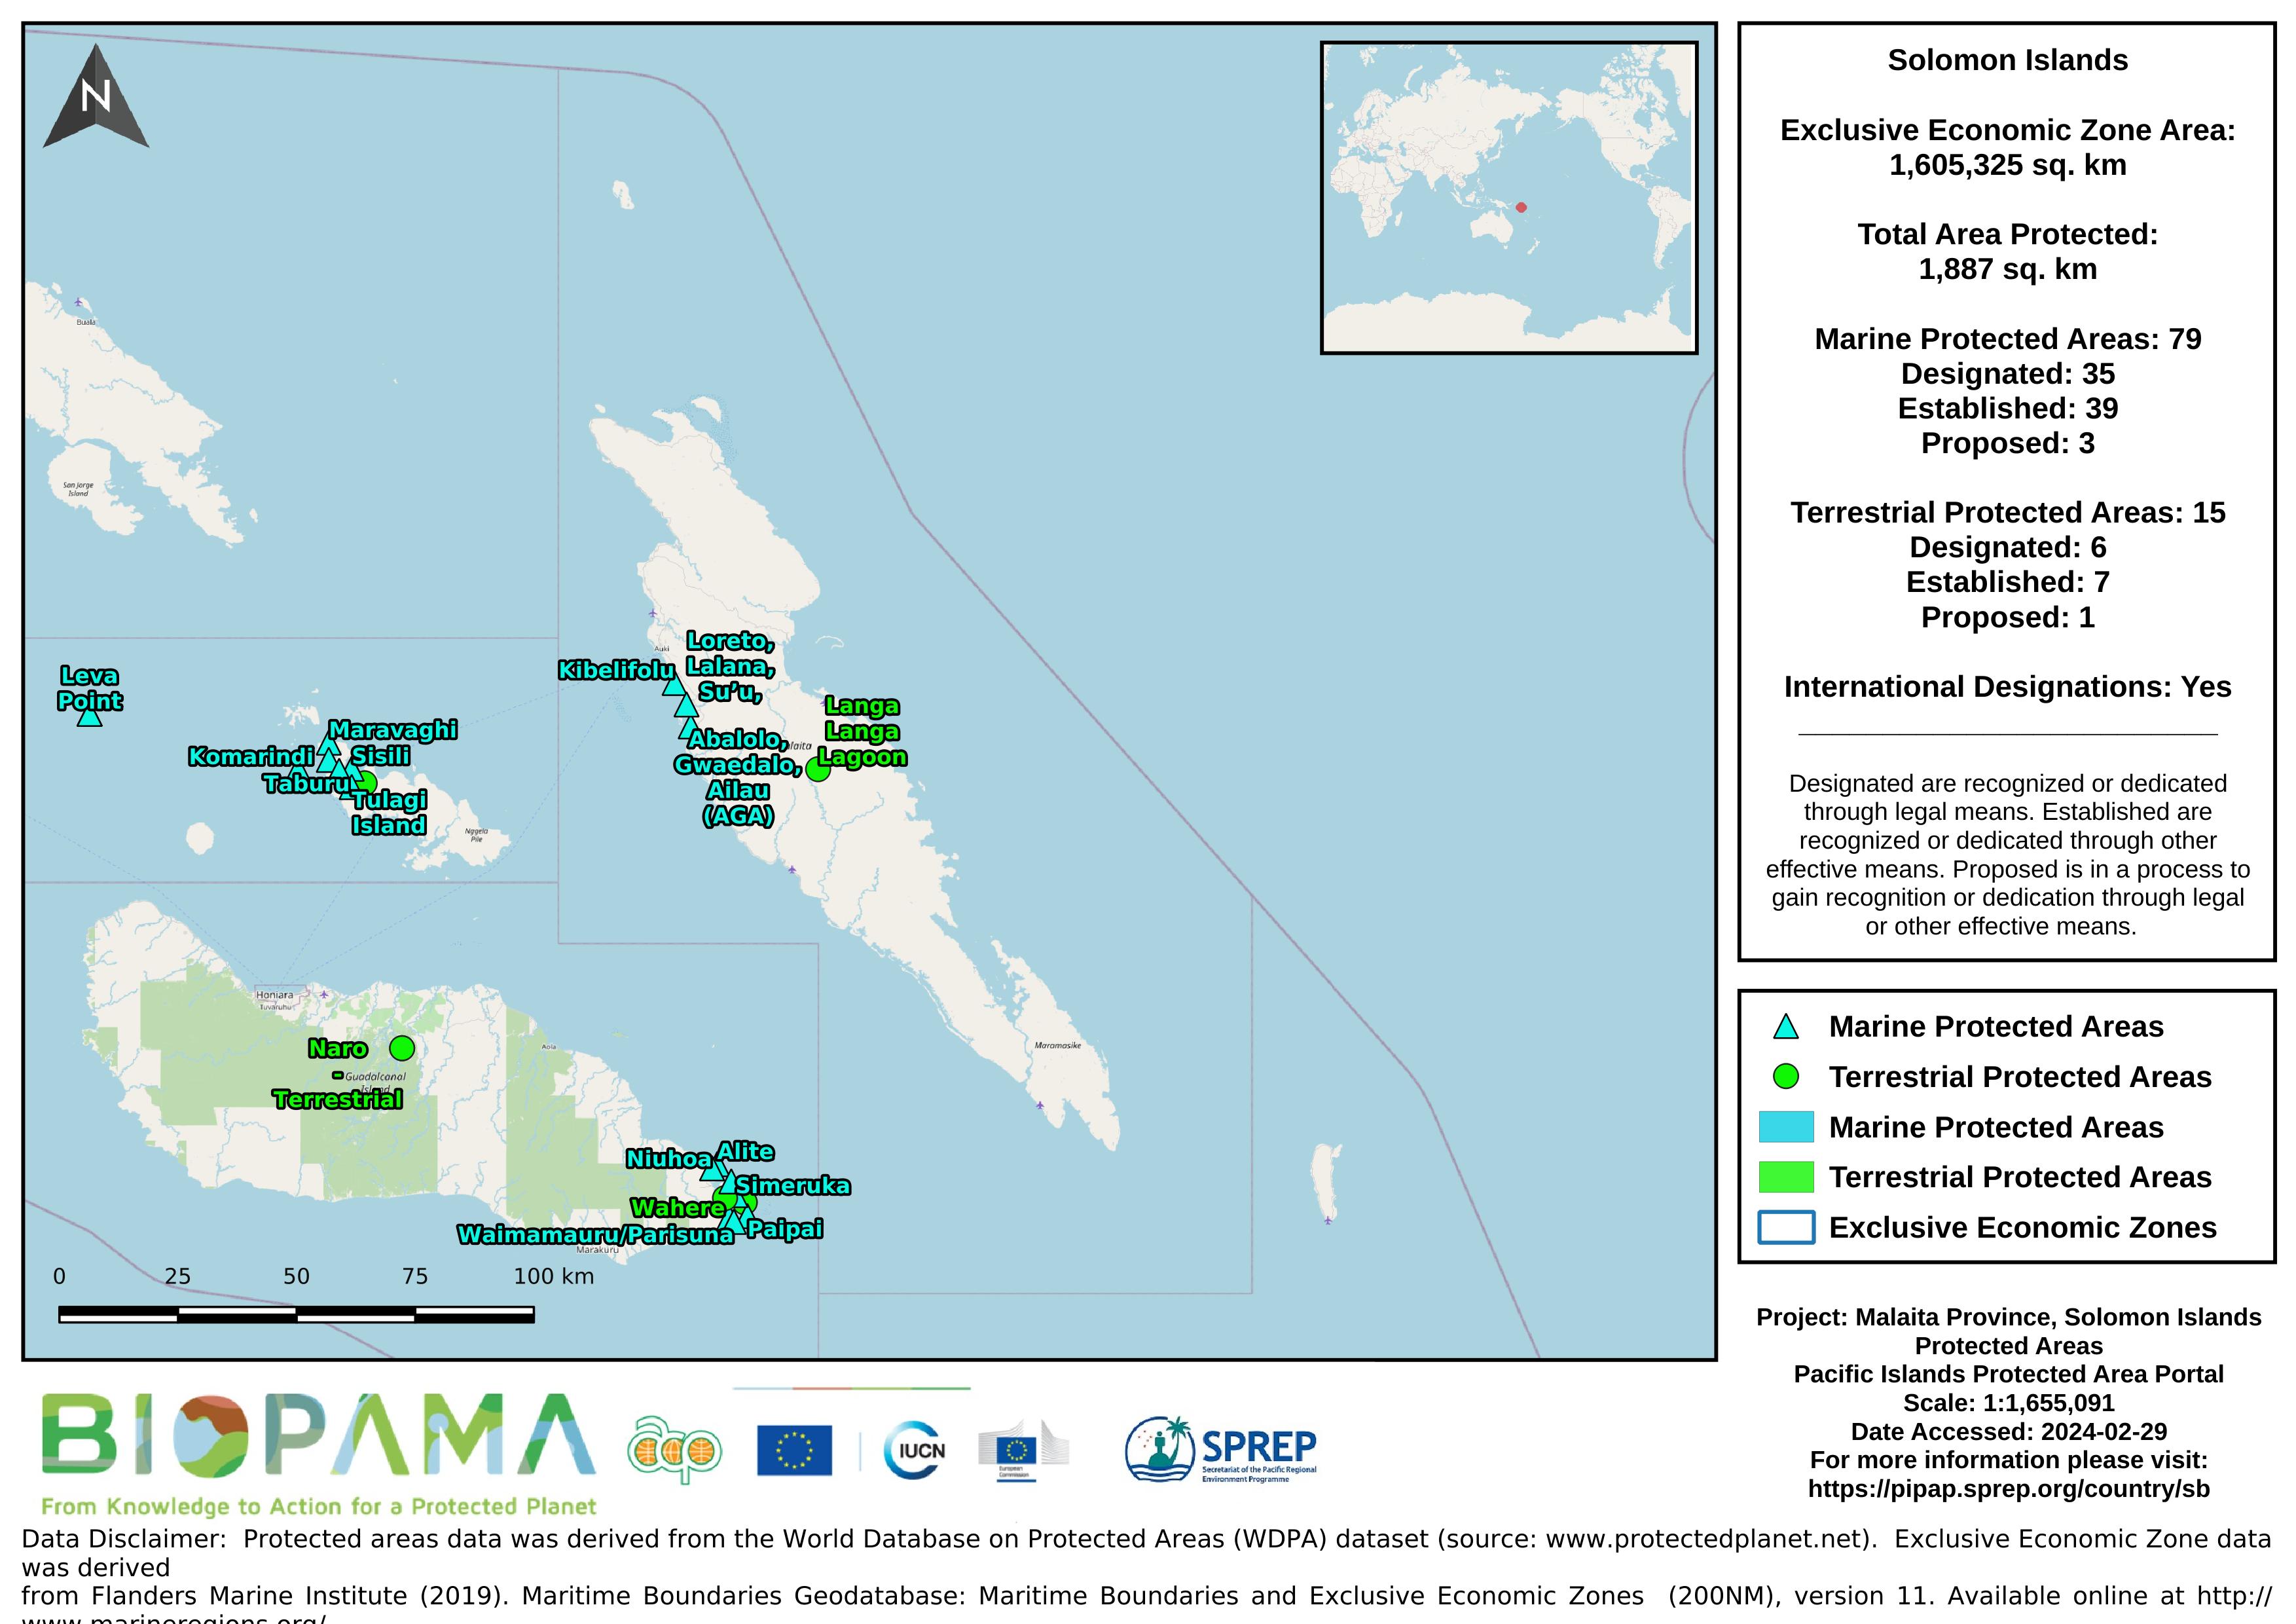
Map of the protected areas for Malaita province in the Solomon Islands with country-level summary statistics on the amount of area under protection, count for each type of protected area (terrestrial or marine), and the count of their designation.
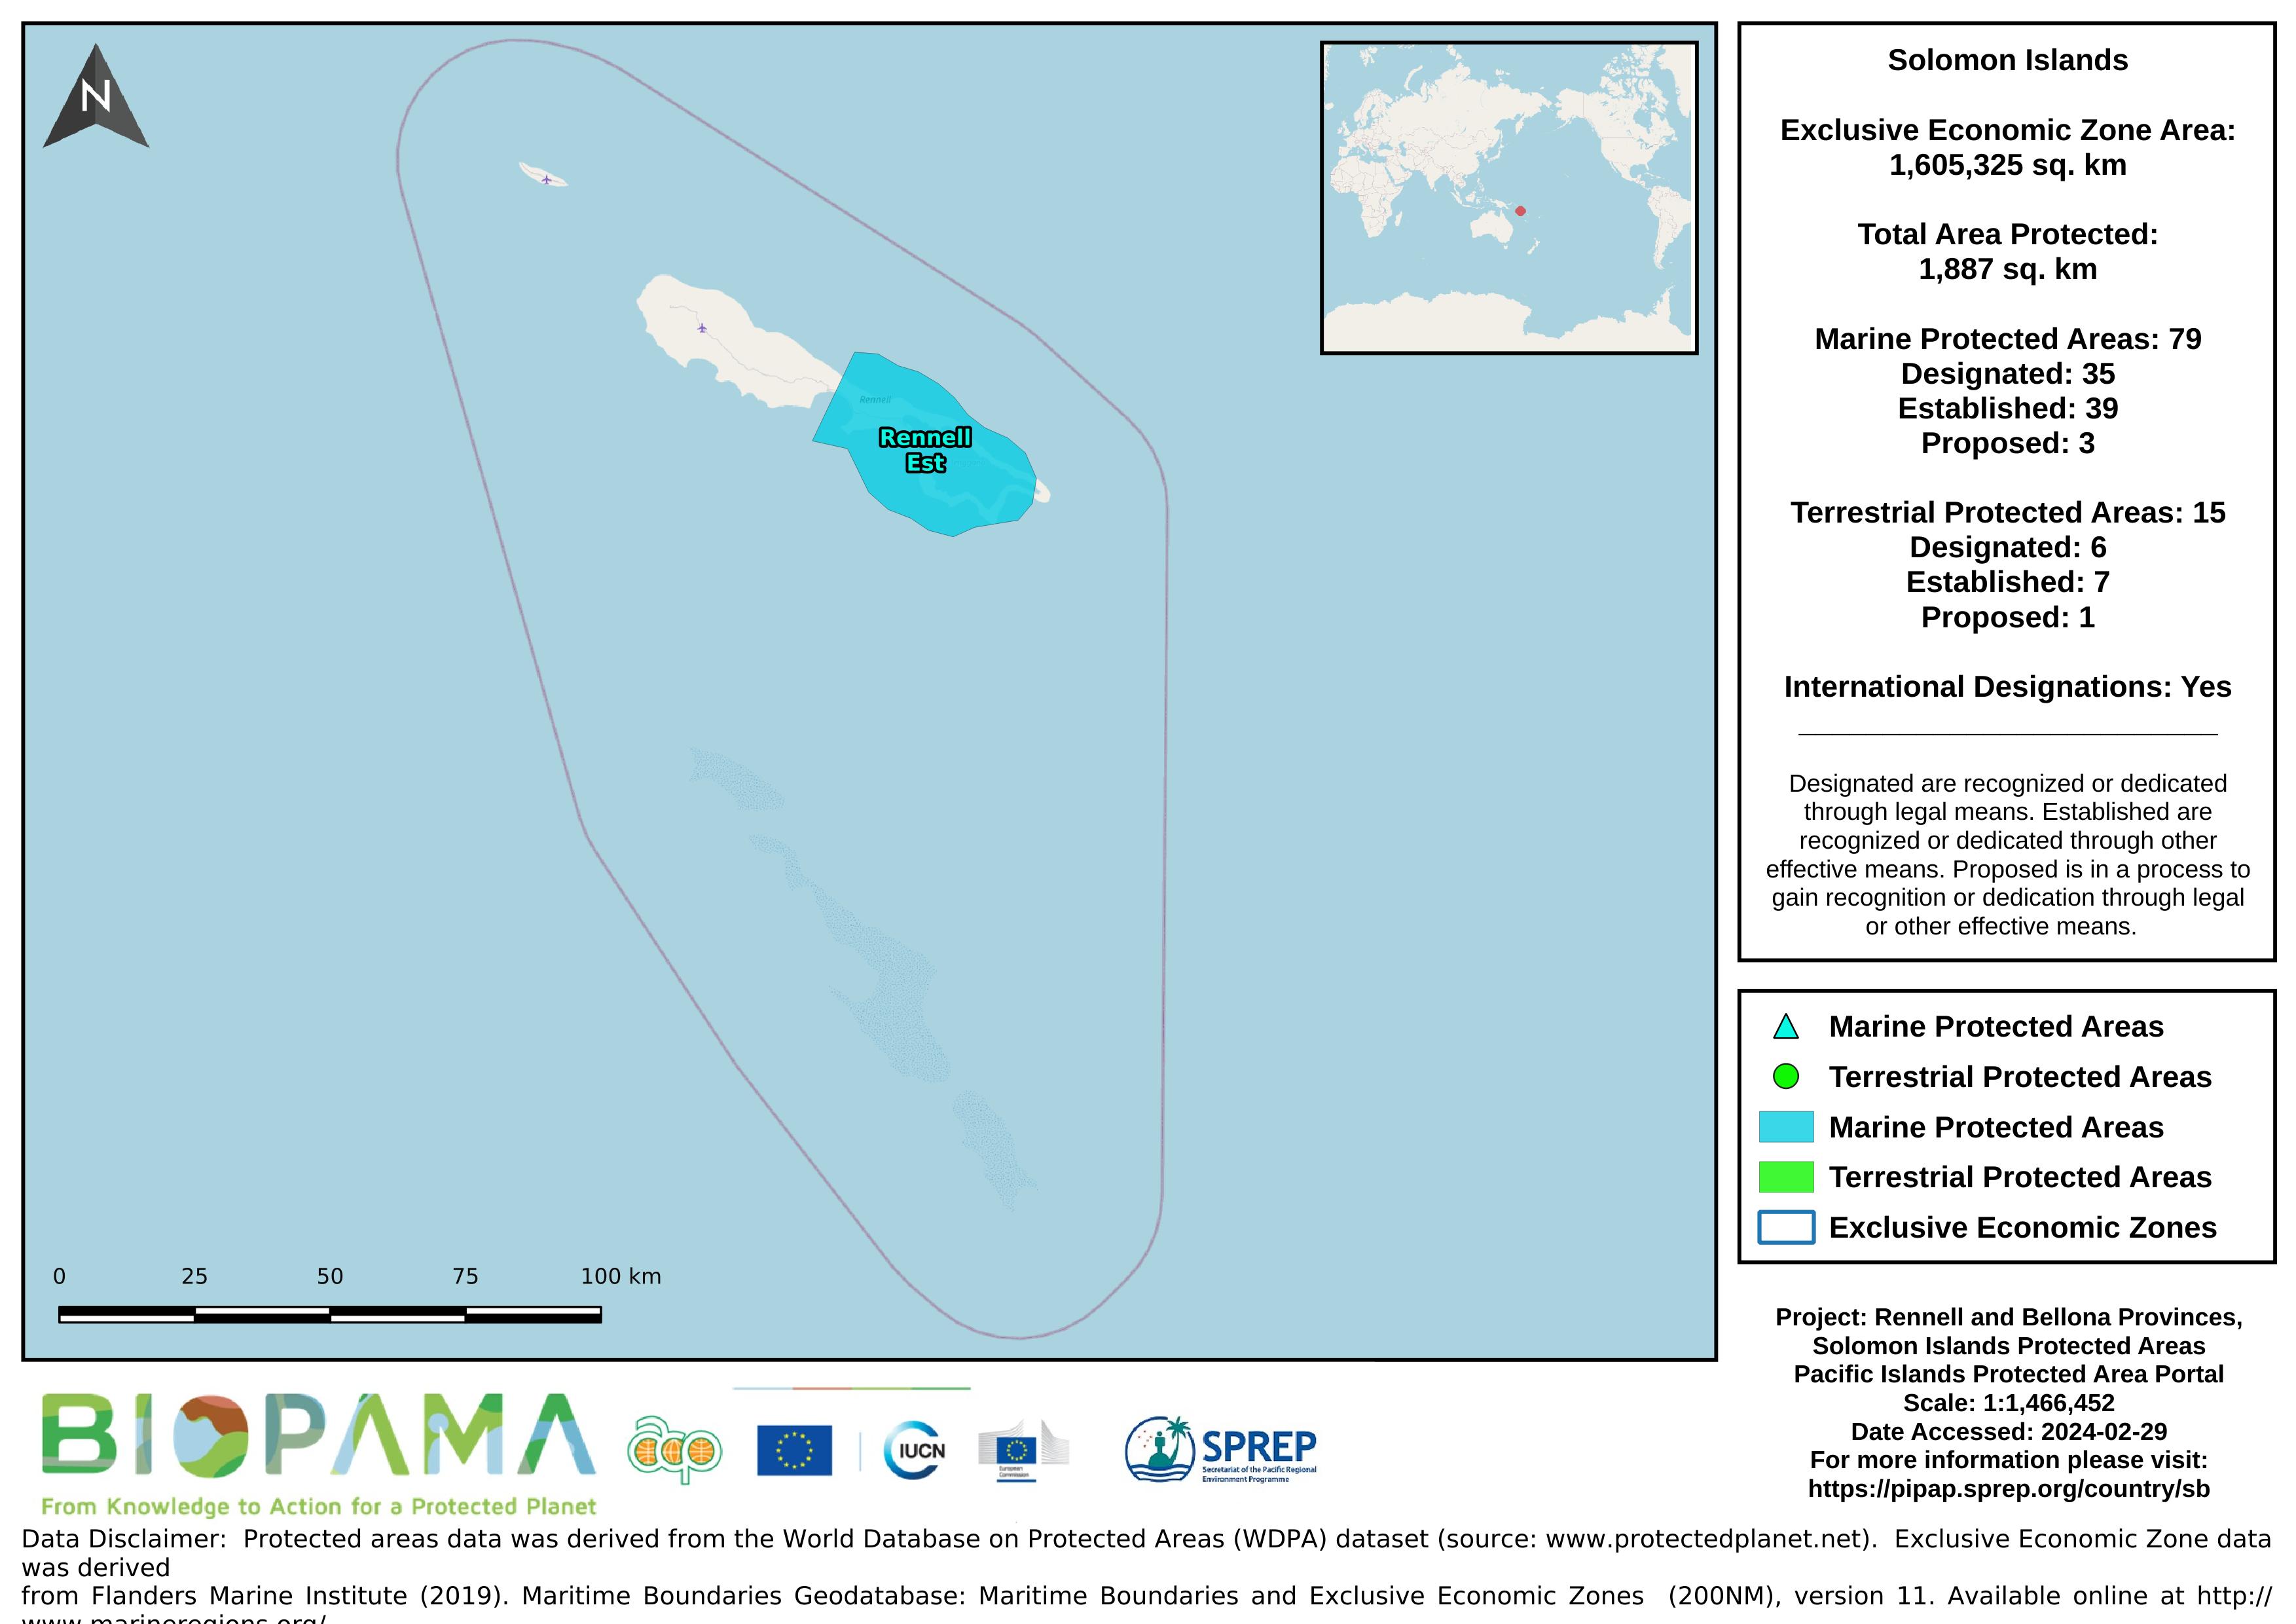
Map of the protected areas for Rennell and Bellona provinces in the Solomon Islands with country-level summary statistics on the amount of area under protection, count for each type of protected area (terrestrial or marine), and the count of their designation.
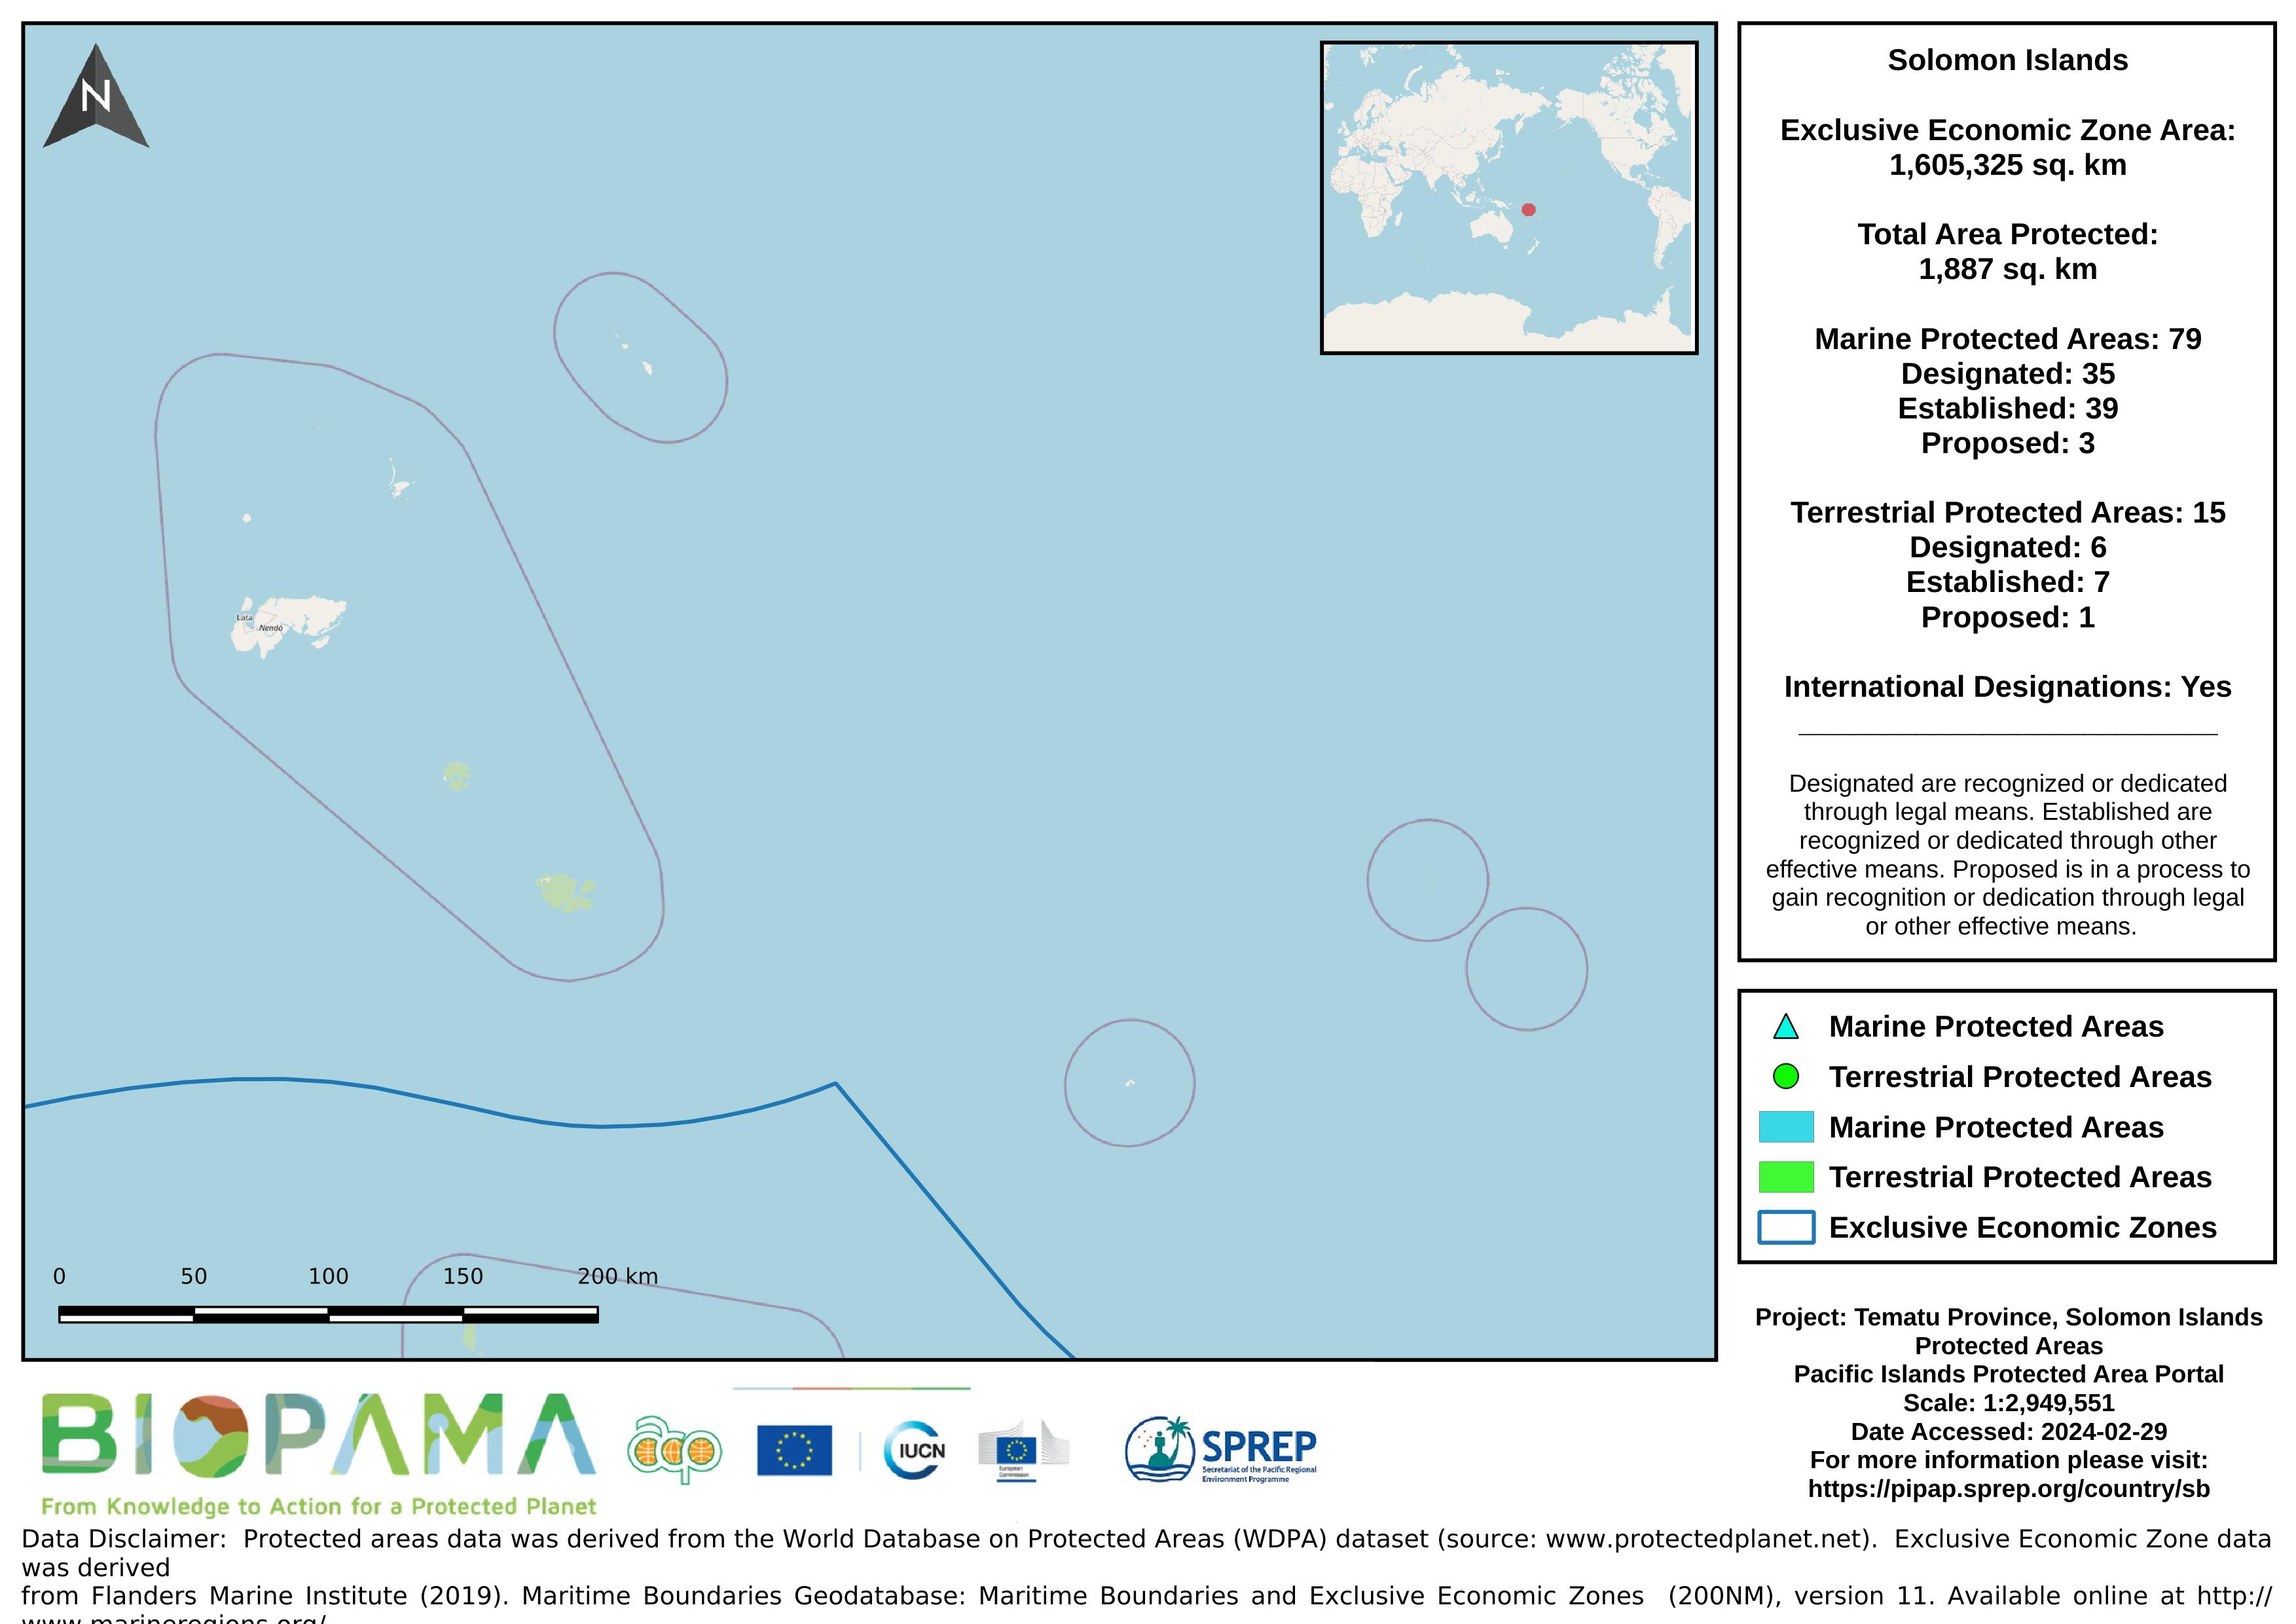
Map of the protected areas for Tematu province in the Solomon Islands with country-level summary statistics on the amount of area under protection, count for each type of protected area (terrestrial or marine), and the count of their designation.
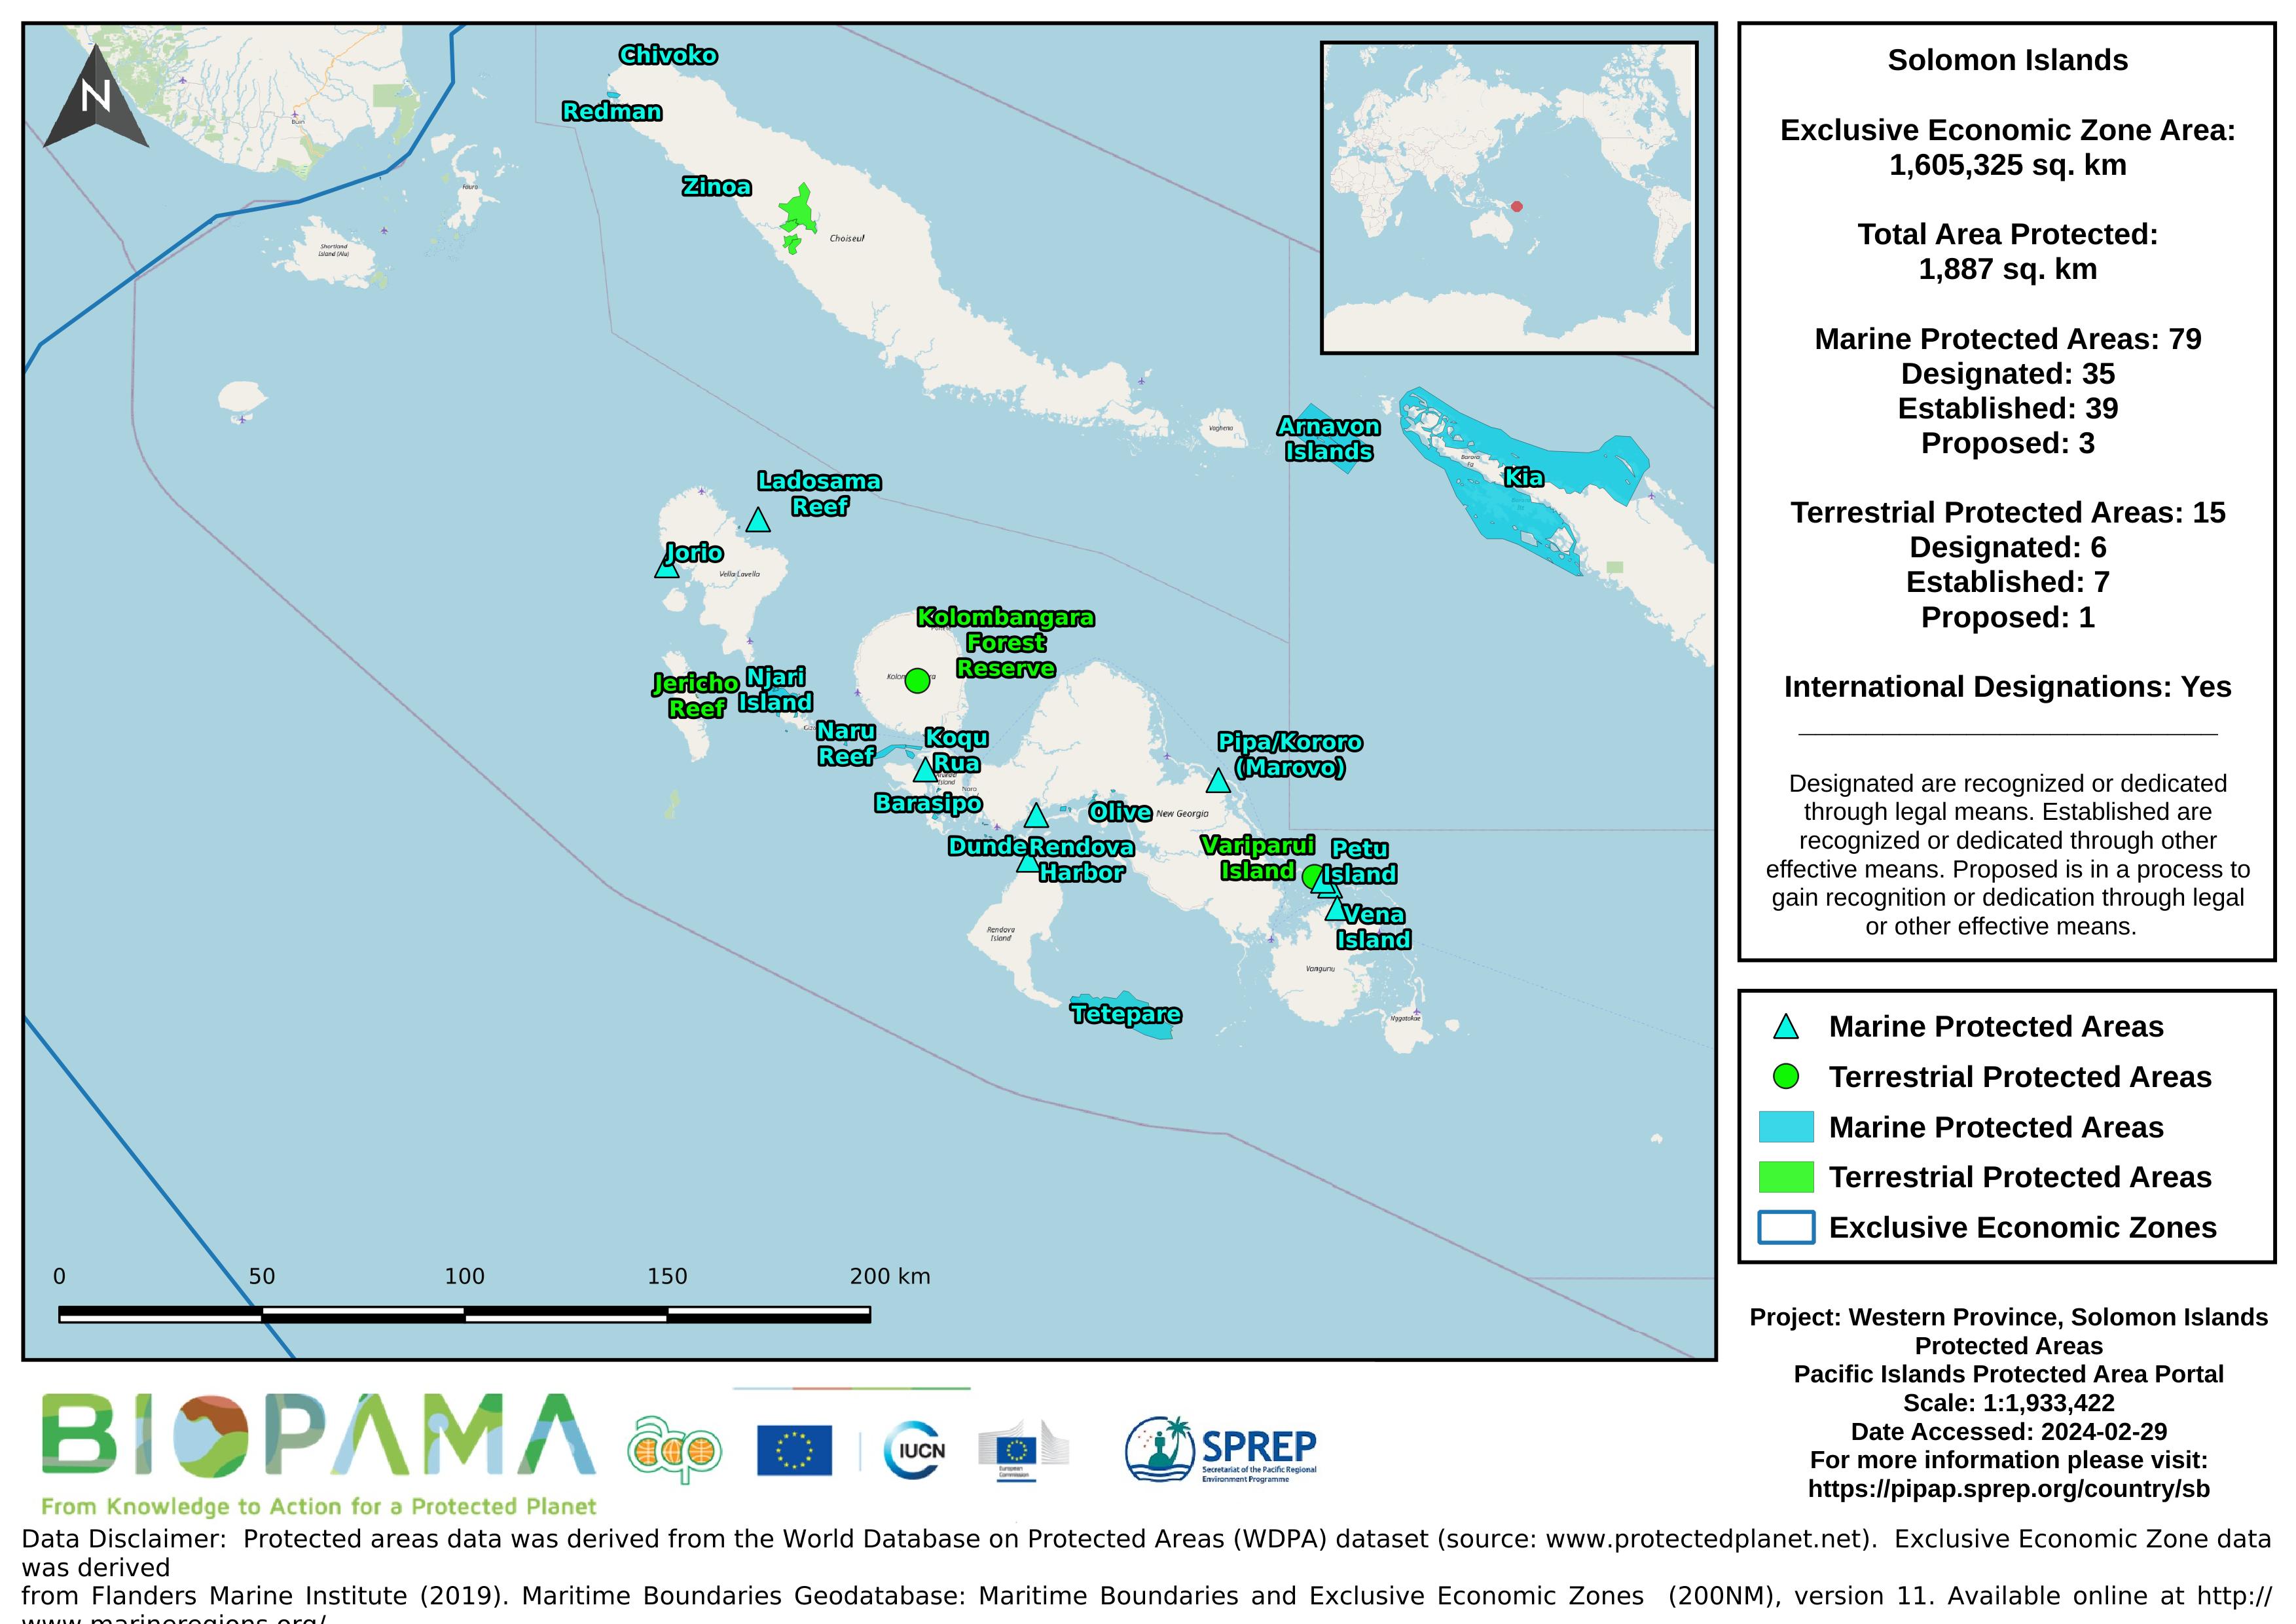
Map of the protected areas for Western province in the Solomon Islands with country-level summary statistics on the amount of area under protection, count for each type of protected area (terrestrial or marine), and the count of their designation.
In a unique move Tokelau requested all regional and international organizations that it is affiliated to either through full membership, associate or by accessing through regional international projects, to visit and consult Tokelau as a "body corporate" or all at once. The intention is to assist a small tiny country in managing all the possible assistance available from these organizations so that the actual assistance itself could be much more effective in their delivery and avoid duplication.
excel version of the data
Excel version of the data on tree cover loss extracted from Global Forest Watch.
The Forest and land use composition of the Solomon Islands study in 2016, shows 7.77% of the total land area was ‘cropland’. Cropland itself comprises 2176 square kilometres. In 2016 the dominant crop type was mixed subsistence agriculture followed by coconut, mixed crops (including coconut overstory) and palm oil Cocoa and ‘other’ agriculture make up the remaining area under cultivation. Includes pie chart.
an excel version of the data with graphical representation.
An excel extraction of the data from the internet link resource
an excel version of the data from the direct internet link
This graph shows the profile of languages in Solomon Islands with respect to their status of language development versus language endangerment. Each individual language that has an entry for Solomon Islands is included in the profile. Adapted from https://www.ethnologue.com/profile/SB.
Excel spreadsheet and associated graph.
The dolphin hunts in the Solomon Islands are typically conducted between January and April, when the seas are calm. Home to the largest drive slaughter of dolphins in the world, annual kills between the years 1976-2013 averaged 850 dolphins per year. Since Dolphin Project began a full-time campaign in 2015 in Fanalei, Solomon Islands, slaughters have dropped to a four-year average of 247 dolphins.
In most villages, affected families lost on average 1 canoe or less, but from the 40 households in Tapurai predisaster, it was estimated that more than 58 canoes were lost.
*data extracted from the pdf report*
Villagers explained that losses of fishing gear were related to the destruction of houses. Fishing gear (lines, goggles, spears etc.) was stored within houses and if a house was washed away by the wave then all gear was lost. An indication of the types of gear that were lost or damaged in the tsunami is given in this data, based on individual interviews with fisher.
*data extracted from pdf report*