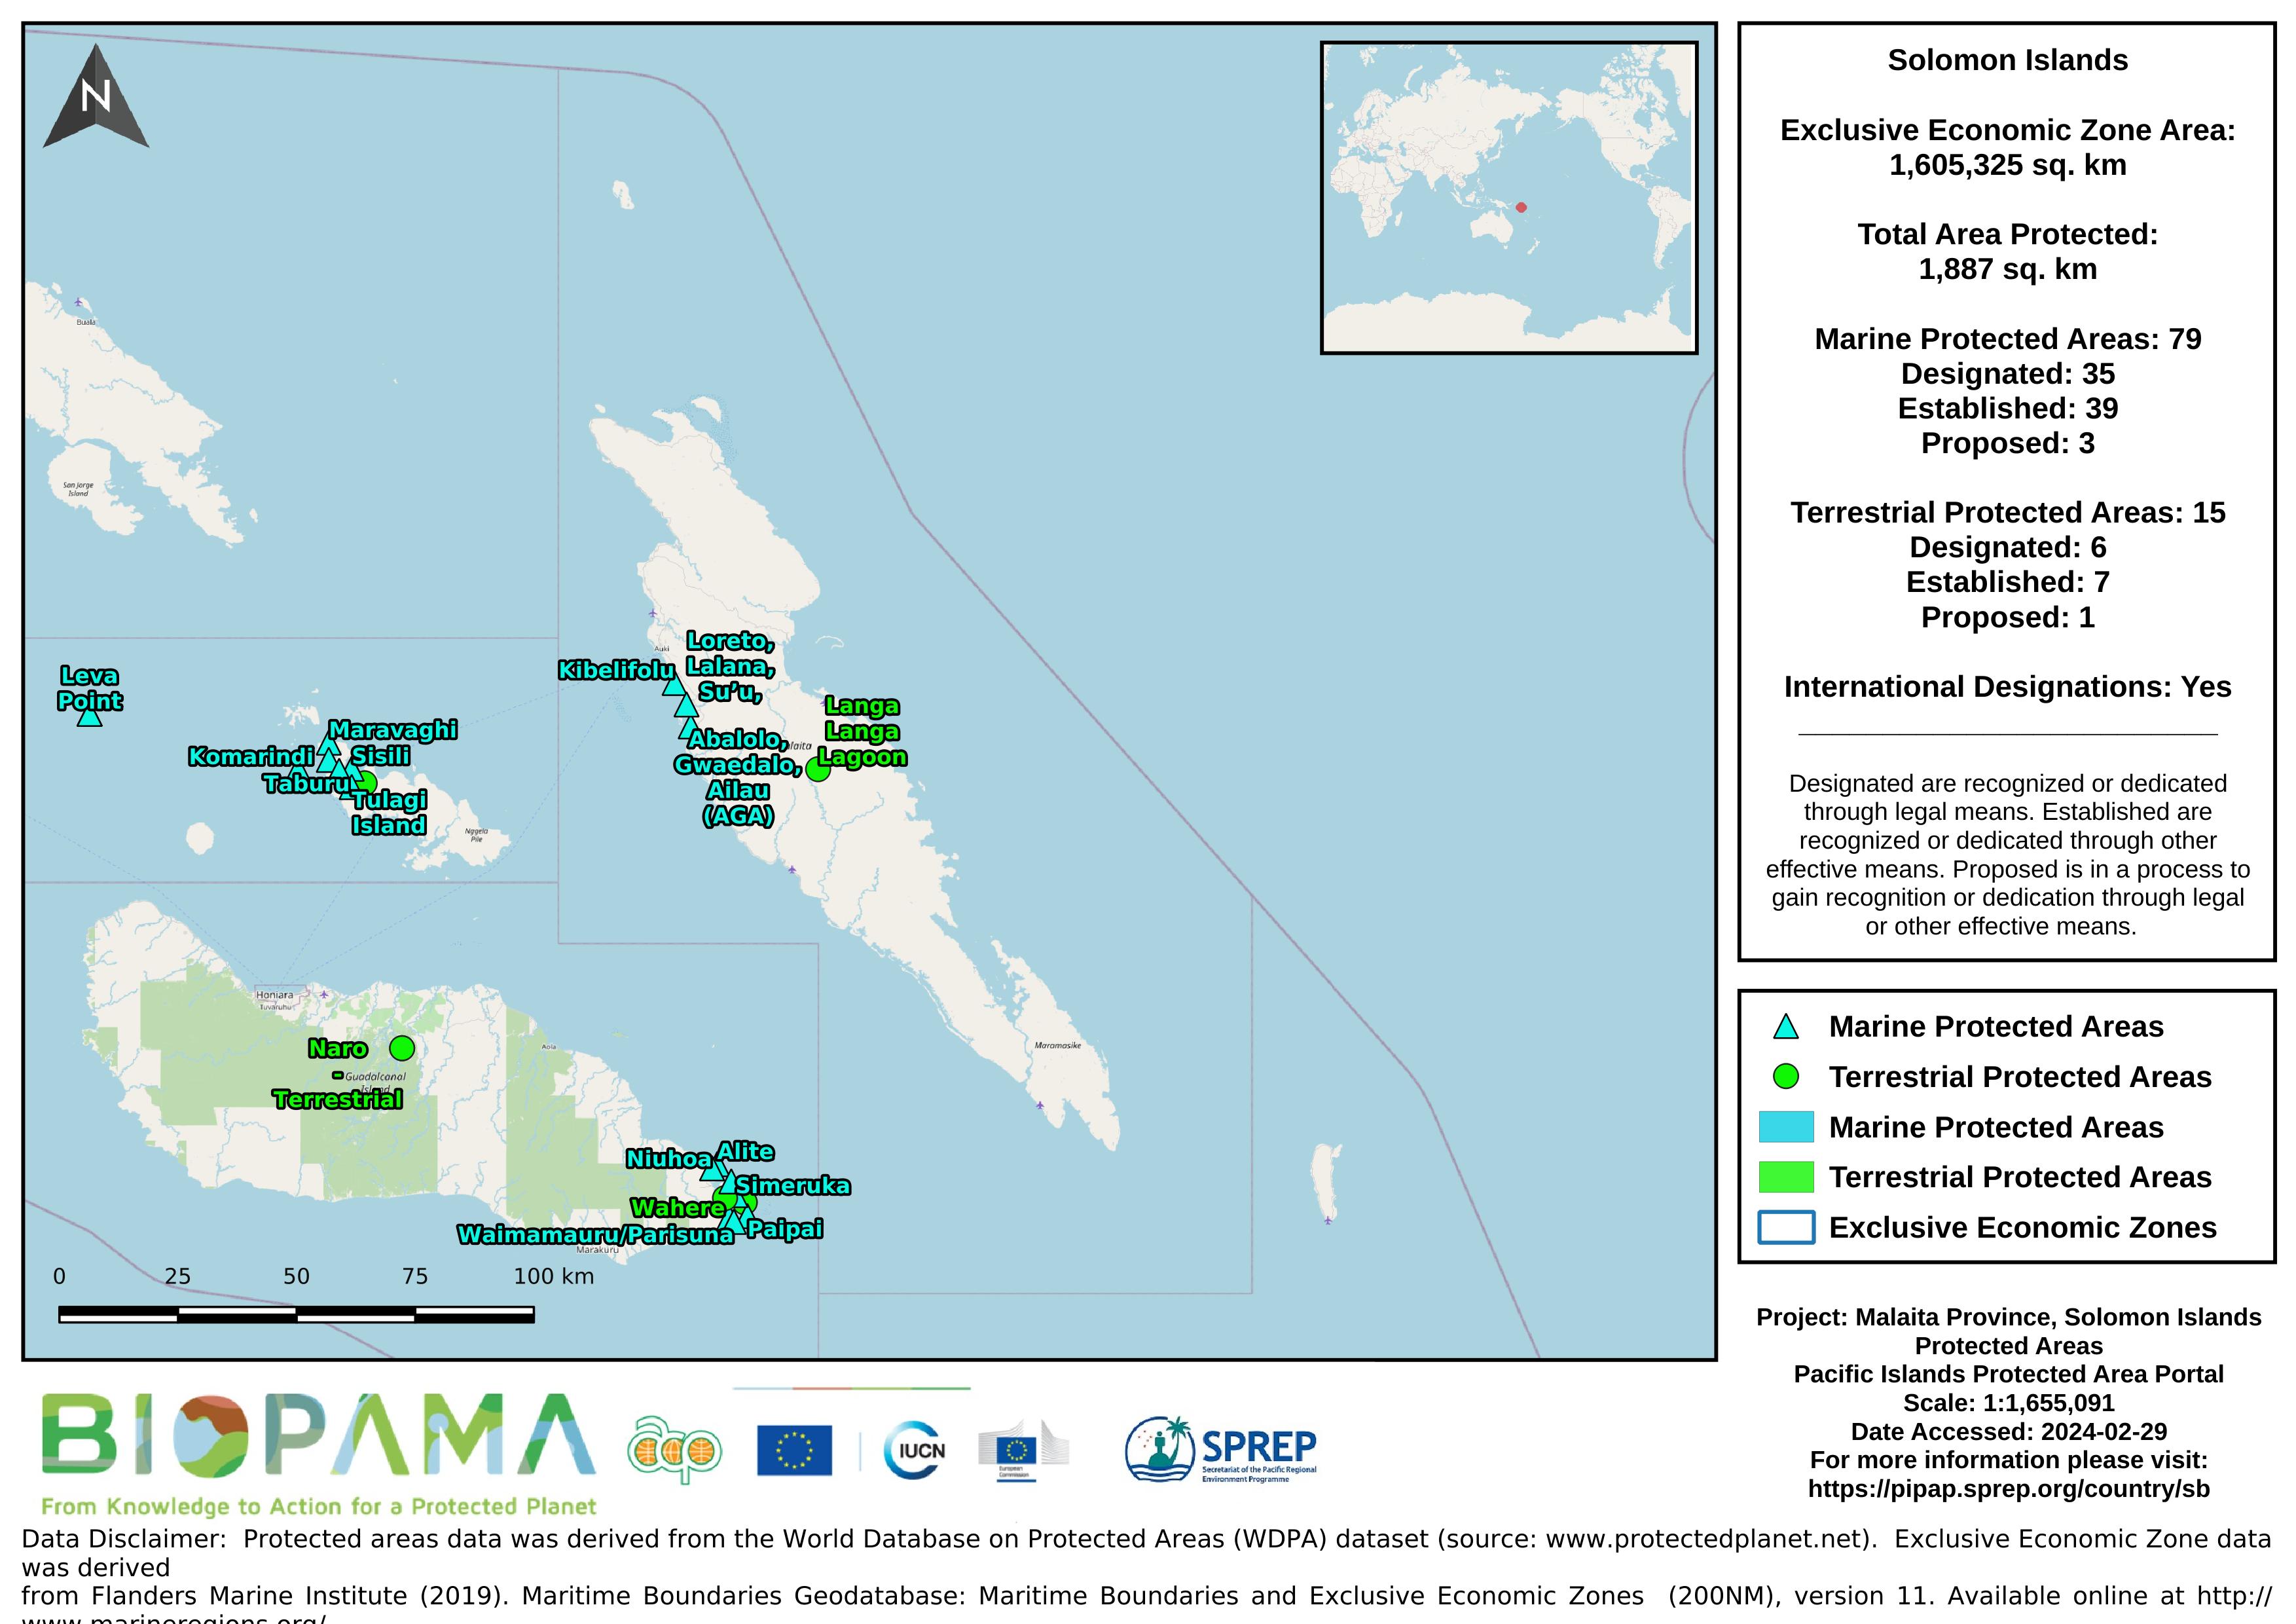
Map of the protected areas for Malaita province in the Solomon Islands with country-level summary statistics on the amount of area under protection, count for each type of protected area (terrestrial or marine), and the count of their designation.
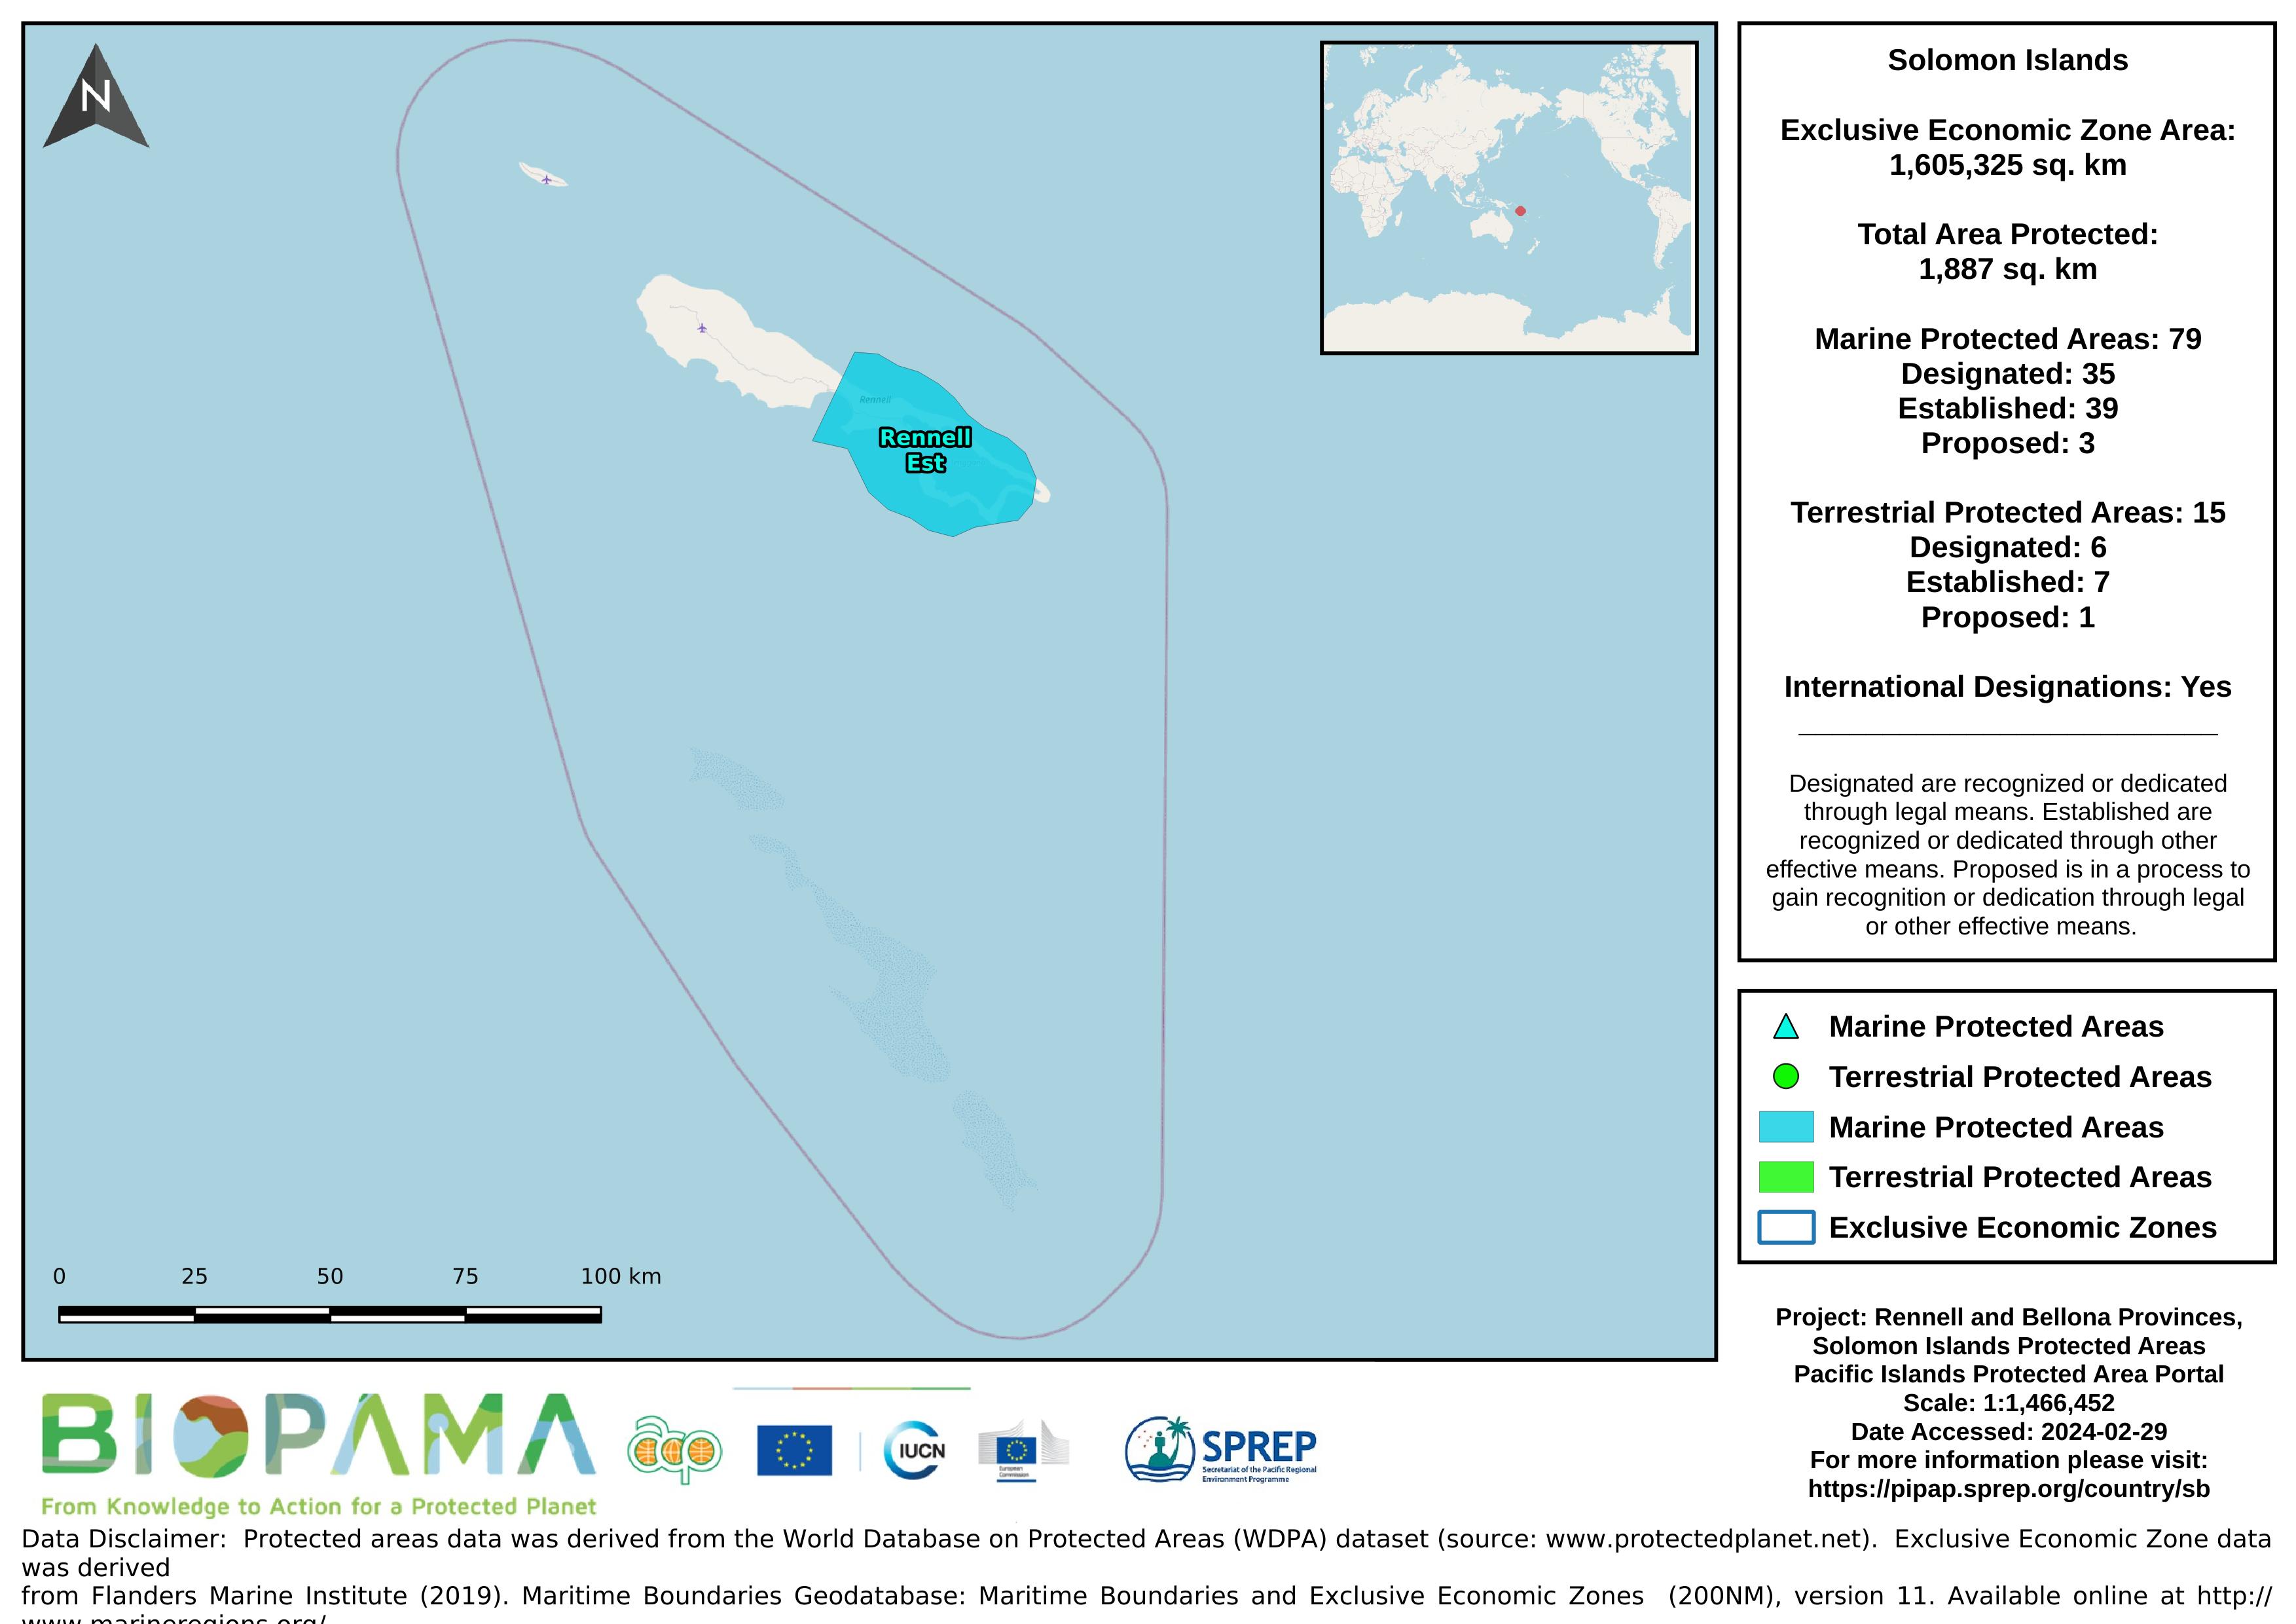
Map of the protected areas for Rennell and Bellona provinces in the Solomon Islands with country-level summary statistics on the amount of area under protection, count for each type of protected area (terrestrial or marine), and the count of their designation.
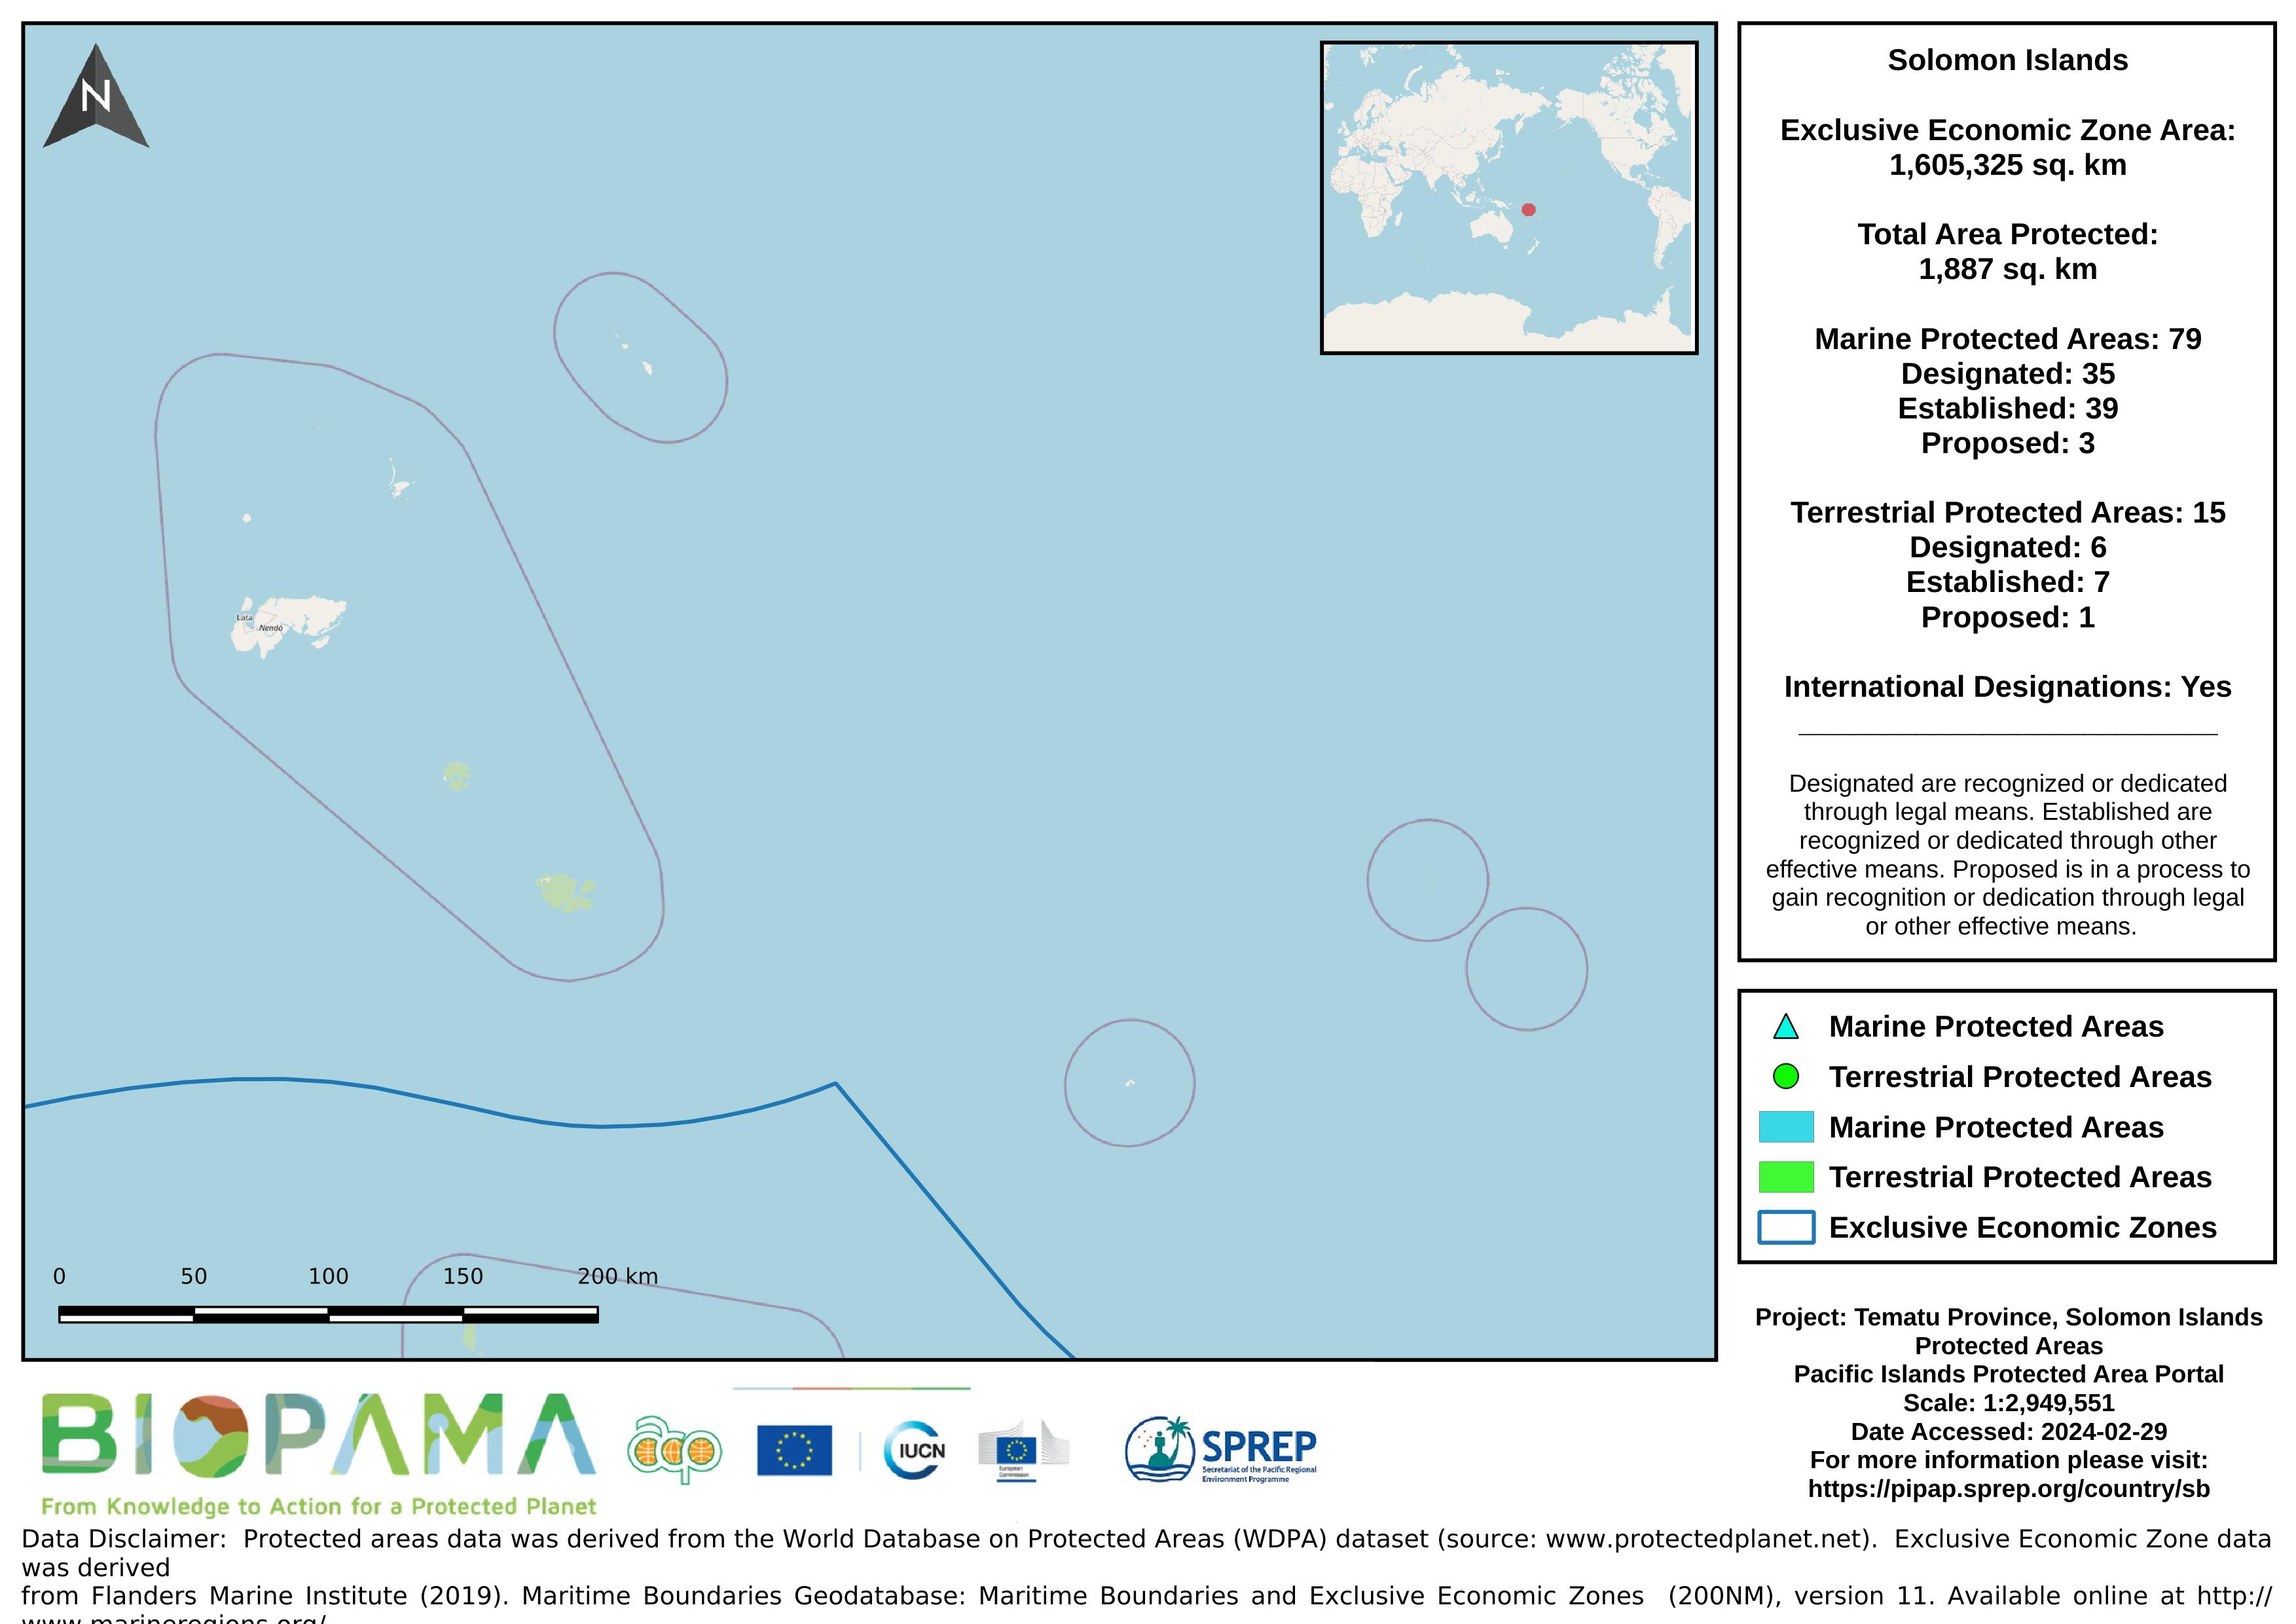
Map of the protected areas for Tematu province in the Solomon Islands with country-level summary statistics on the amount of area under protection, count for each type of protected area (terrestrial or marine), and the count of their designation.
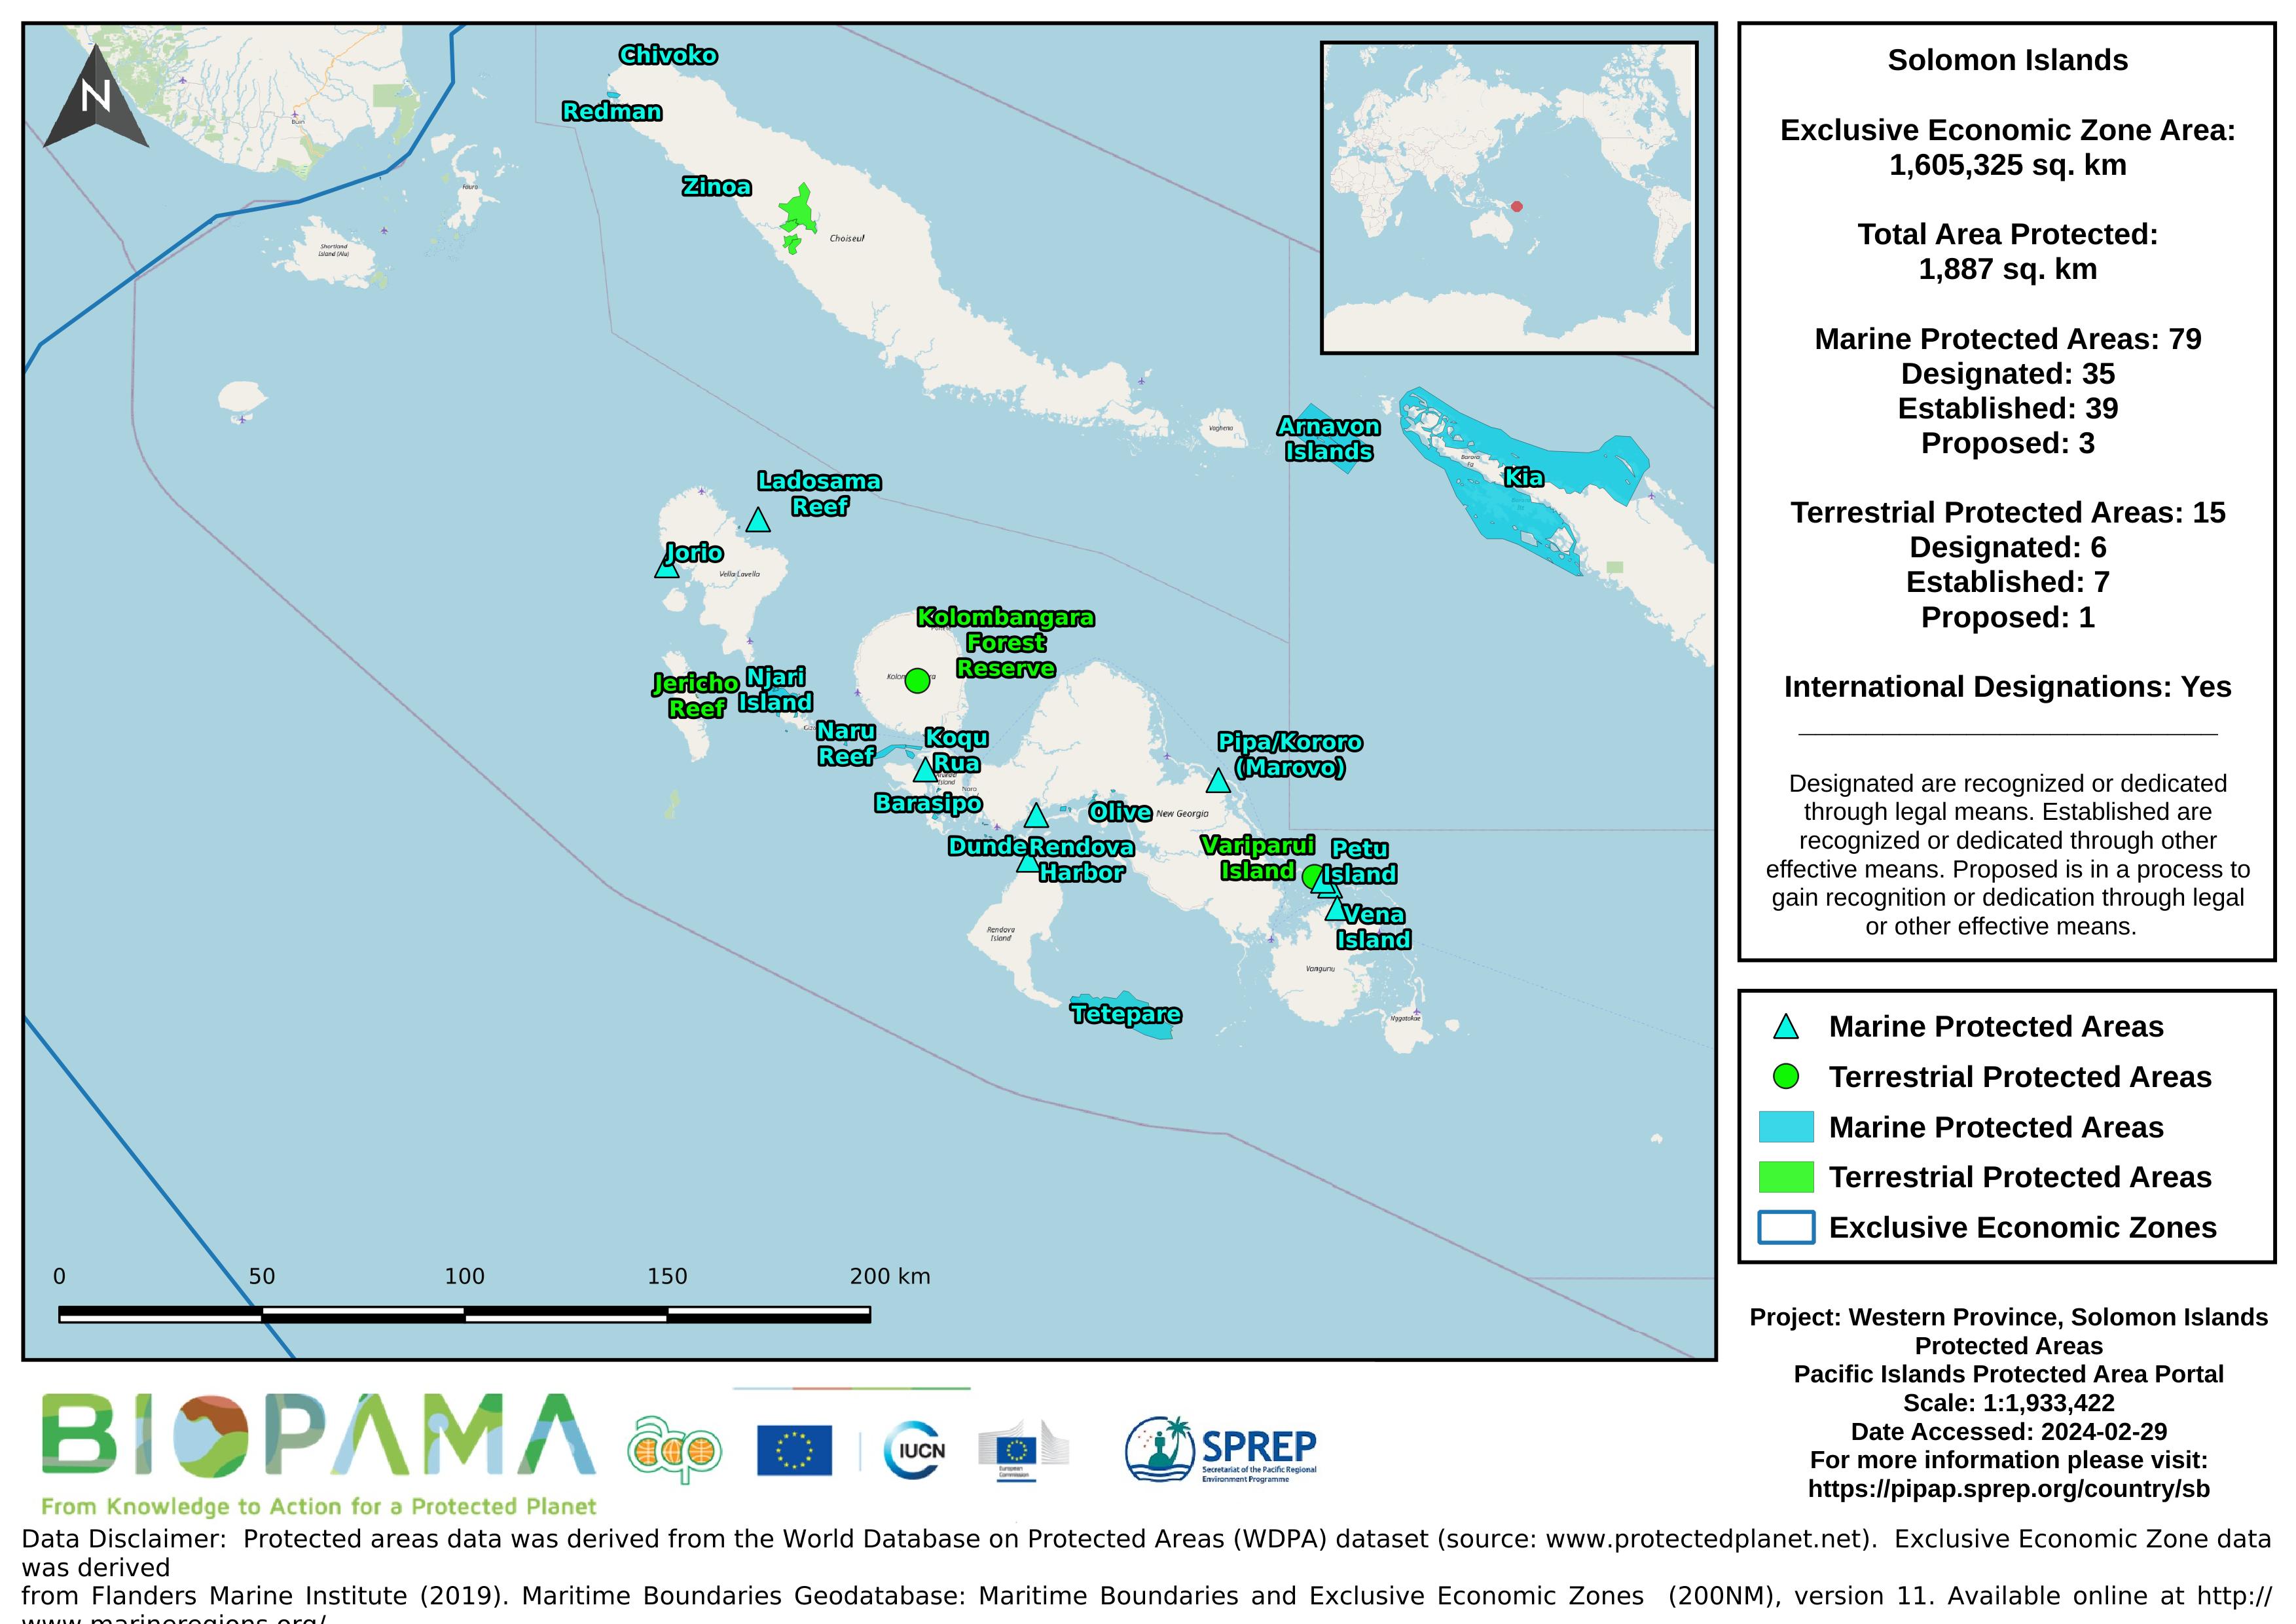
Map of the protected areas for Western province in the Solomon Islands with country-level summary statistics on the amount of area under protection, count for each type of protected area (terrestrial or marine), and the count of their designation.
Marine waste incidences per country reported by observers
This represents sub-sectors within the Cropland category (which is 7.77 of total land)
The respective question asked in the 2009 census was “Does this household have any livestock?”, and answer boxes were provided for the number of cows, pigs, goats, horses, and poultry.
Data extracted from the the 2009 Census
Global Forest Watch data. Tree cover loss is not the same as deforestation. Tree cover loss means the removal of tree canopy due to human and natural causes, and includes trees in plantations as well as natural forests.
the rate of population growth from 1931 - 2009
excel version of the data
Excel version of the data on tree cover loss extracted from Global Forest Watch.
The Forest and land use composition of the Solomon Islands study in 2016, shows 7.77% of the total land area was ‘cropland’. Cropland itself comprises 2176 square kilometres. In 2016 the dominant crop type was mixed subsistence agriculture followed by coconut, mixed crops (including coconut overstory) and palm oil Cocoa and ‘other’ agriculture make up the remaining area under cultivation. Includes pie chart.
an excel version of the data with graphical representation.